Blog

San Francisco Market Update | June 2026

Select macro-economic and demographic data for the country and the Bay Area – June 2026

Compass

June 2026 San Francisco House & Condo Markets

Market Outlook


Data through May 2026

June 2026

Housing Market Report

Select macro-economic and demographic data for the country and the Bay Area – June 2026

Clients, friends, and colleagues:


We all know the market here in San Francisco is hyper competitive. Yes, it's always segment and property-specific, but demand is outweighing supply by a large margin, and we are really starting to see it spill over even into our downtown (South Beach) condo market. This is my biggest change since my May update; our high-rises in South Beach are seeing quicker sales and more demand. Rents are spiking and buyers are feeling more urgency.


Here's some quick, bite-sized data points:

(1) The average 30-YR fixed remained at 6.49% for the 6th consecutive week per Freddie Mac. If tensions with Iran continue to cool, expect mortgage rates to drop. If rates drop, expect demand to get even fiercer. But inflation makes a drop in interest rates less likely.


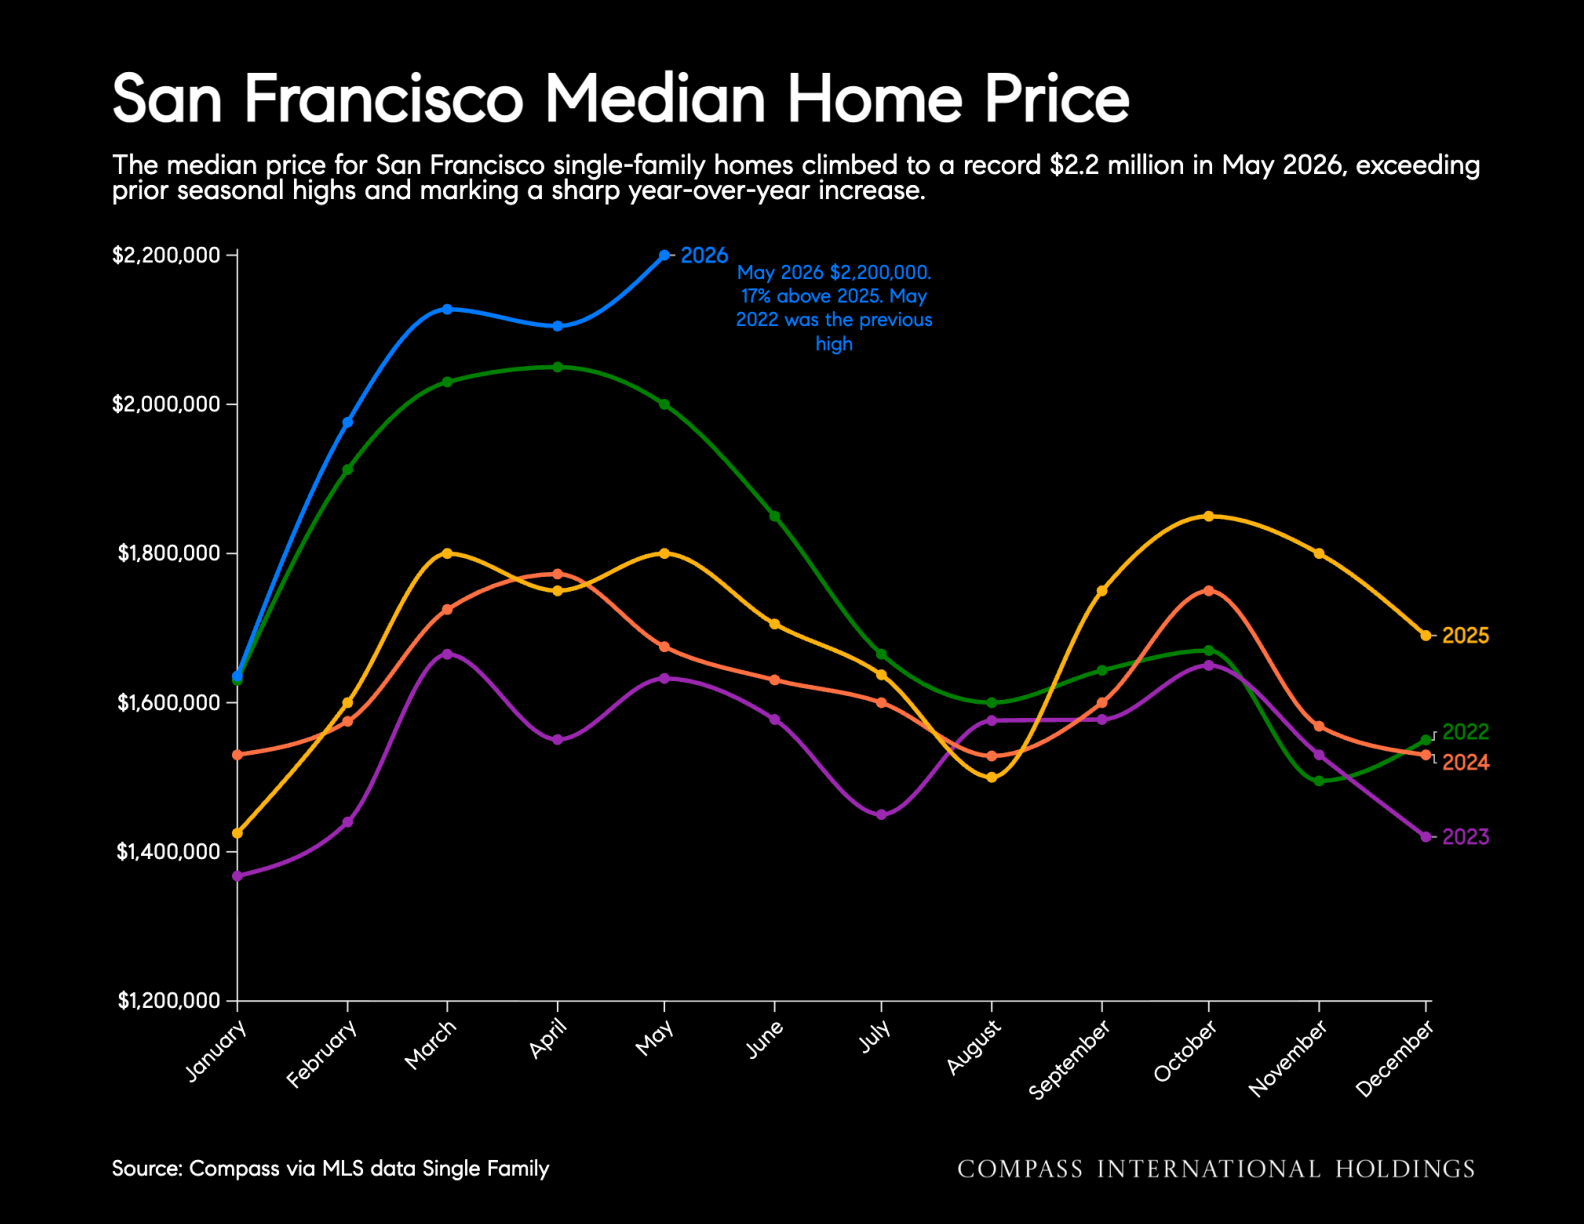
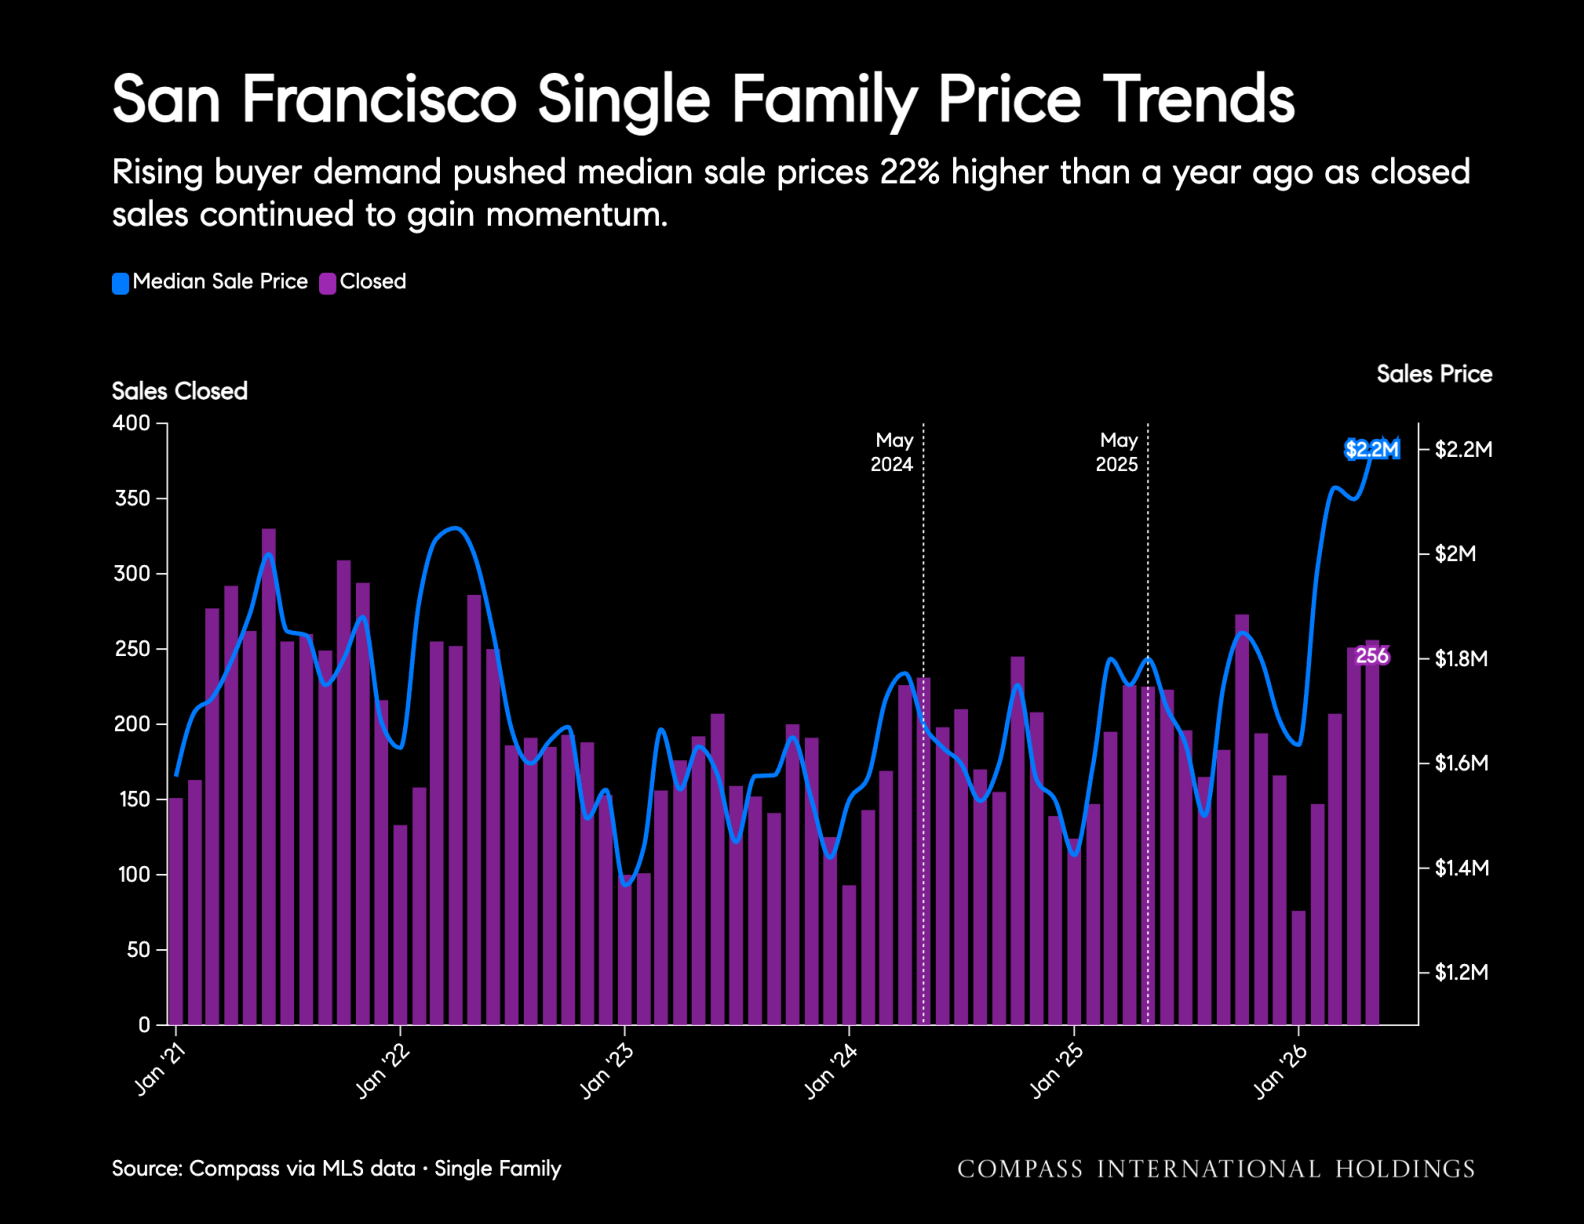
(2) The median price for a single-family home in San Francisco is $2,150,000 as of the end of May, a 21% jump year-over-year.


(3) The median price for a condo in San Francisco is $1,350,000 as of the end of May, a 12.5% jump year-over-year.


(4) Median days on market is 13, down from 17 year-over-year.


My buyer successes have come from being bold with your offers: scrutinize the data but also understand the momentum of the market, and keeping an eye-out for off-market opportunities. Here in the summer swing, you can find sellers who are willing to sell now vs. prepping for the Fall market.


For a more macro perspective from our chief Economist:

The Bay Area housing market hit a lot of national headlines in May. In San Francisco, AI and tech-driven demand has created aggressive bidding wars on the scarce inventory. Skyrocketing rents are back in the norm. Even the city’s condo market, which has been under pressure for six years, is showing signs of demand recovery.


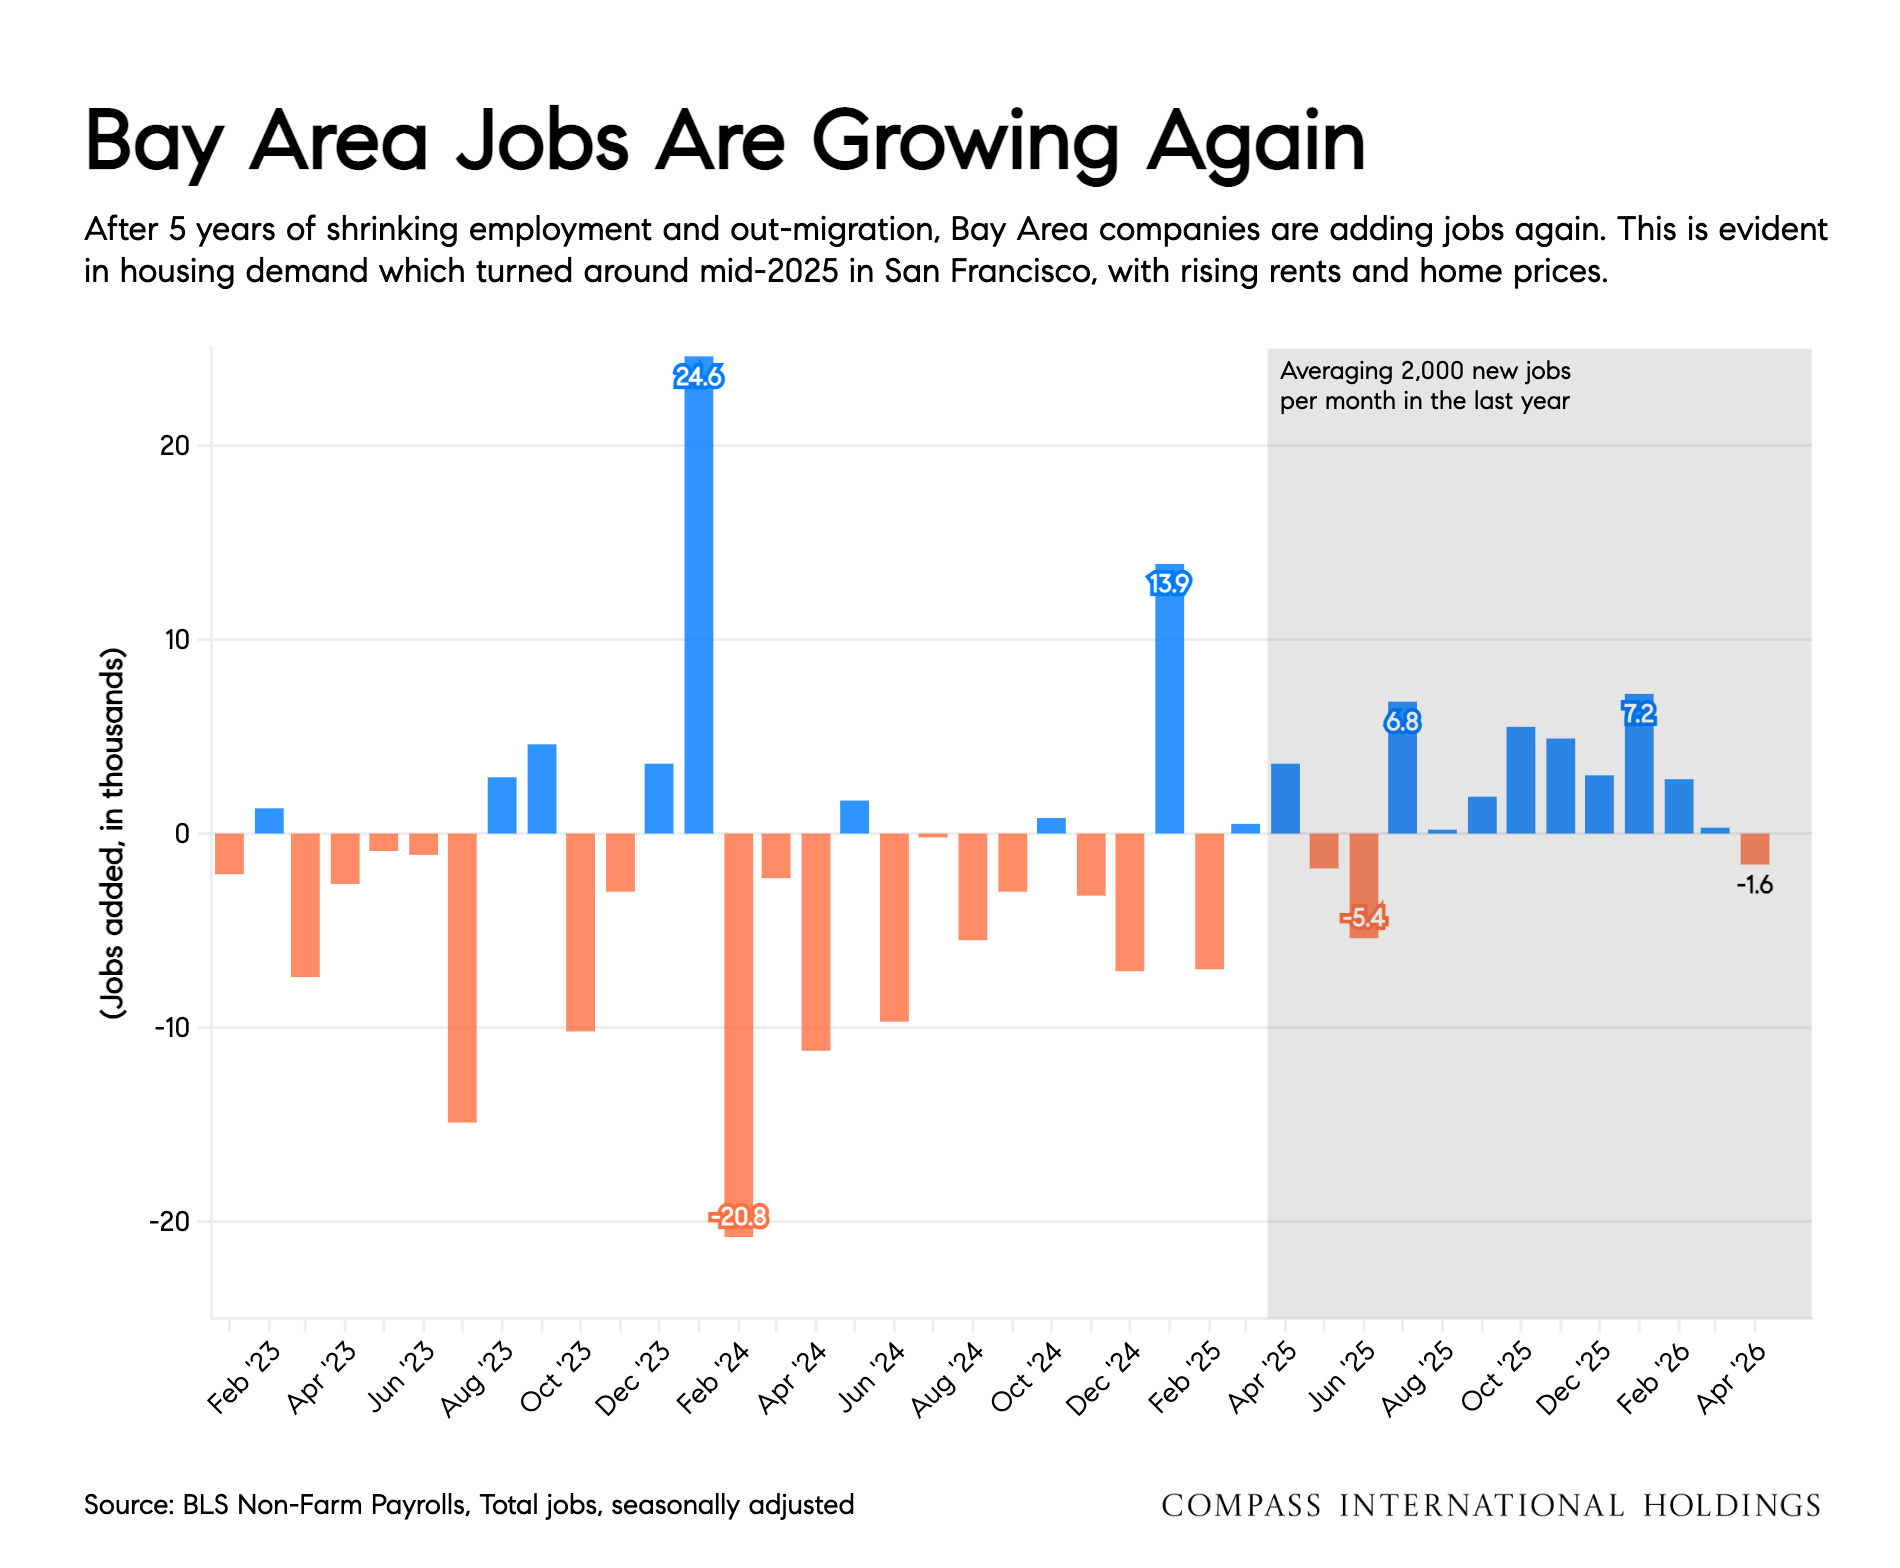
For the first time in many years job creation in the Bay Area is positive and economic opportunity is attracting net inbound migration, despite the region’s chronic shortage of homes and affordability issues. It’s notable that other tech cities like Seattle and Austin are not seeing the boom in the real estate market related to AI. In fact, those cities are now sending more people to San Francisco than the reverse.


While the city dominates the headlines, many areas have not seen the massive wealth effect driving home buying demand like the city has. In this cycle, this resurgent demand is so far concentrated to a very small section in the city, and luxury markets in Peninsula and Marin.


For much of the region, interest rates matter more than stock market performance. In May, mortgage rates jumped higher with sharply higher inflation data. That tension between higher interest rates and the wealth effect is likely to continue for the rest of 2026. Inflation pressures have been pushing higher, and it seems unlikely that interest rates will dip again very soon.


If you have any questions about a specific property, I'm always here to help!


Warm regards,

Ron


Recent sales & review @ the bottom of this email.


Mortgage rate chart from April 2023 to June 2026, ending at 6.6% after a low of 5.99%.
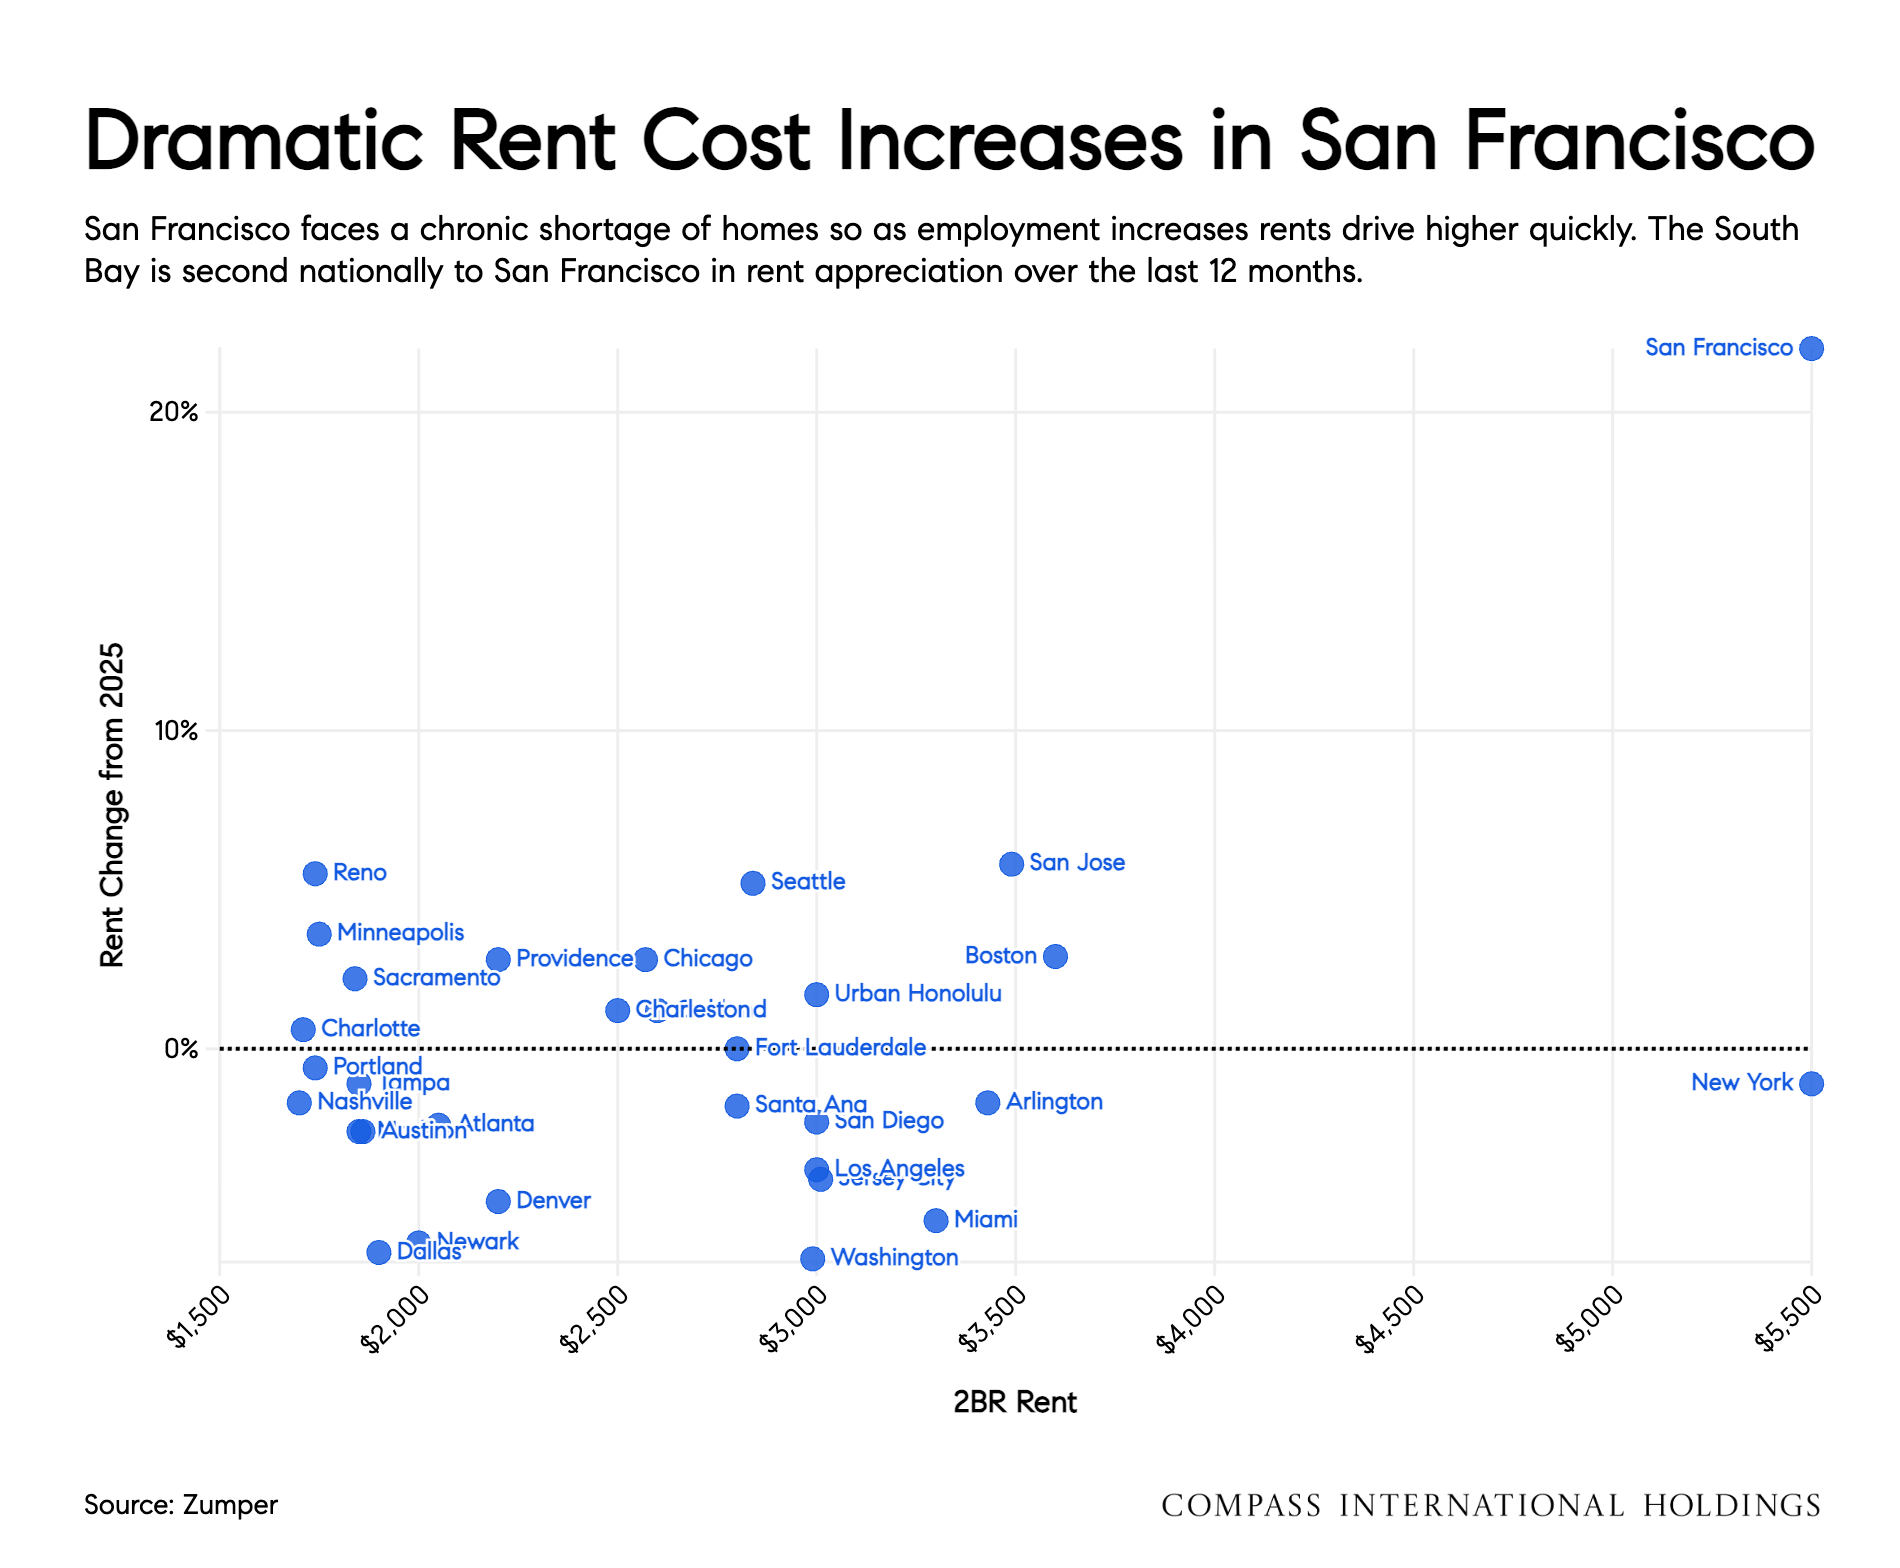
Chart comparing two-bedroom rents and rent changes across U.S. cities, with San Francisco highest in rent growth.
Chart comparing San Francisco and national CPI from 2016 to 2026, with both ending near 3.8%.
Bar chart of monthly U.S. job gains and losses from January 2023 to May 2026, with a 2026 monthly average of 114,000.
Bar chart of Bay Area monthly job changes, with gains averaging 2,000 jobs per month in the last year.
Chart of S&P daily change from January 2025 to June 2026, surging to a new high in May 2026.
Chart of 2025 Bay Area household migration, with Seattle leading inbound moves and Seattle and Reno leading outbound moves.
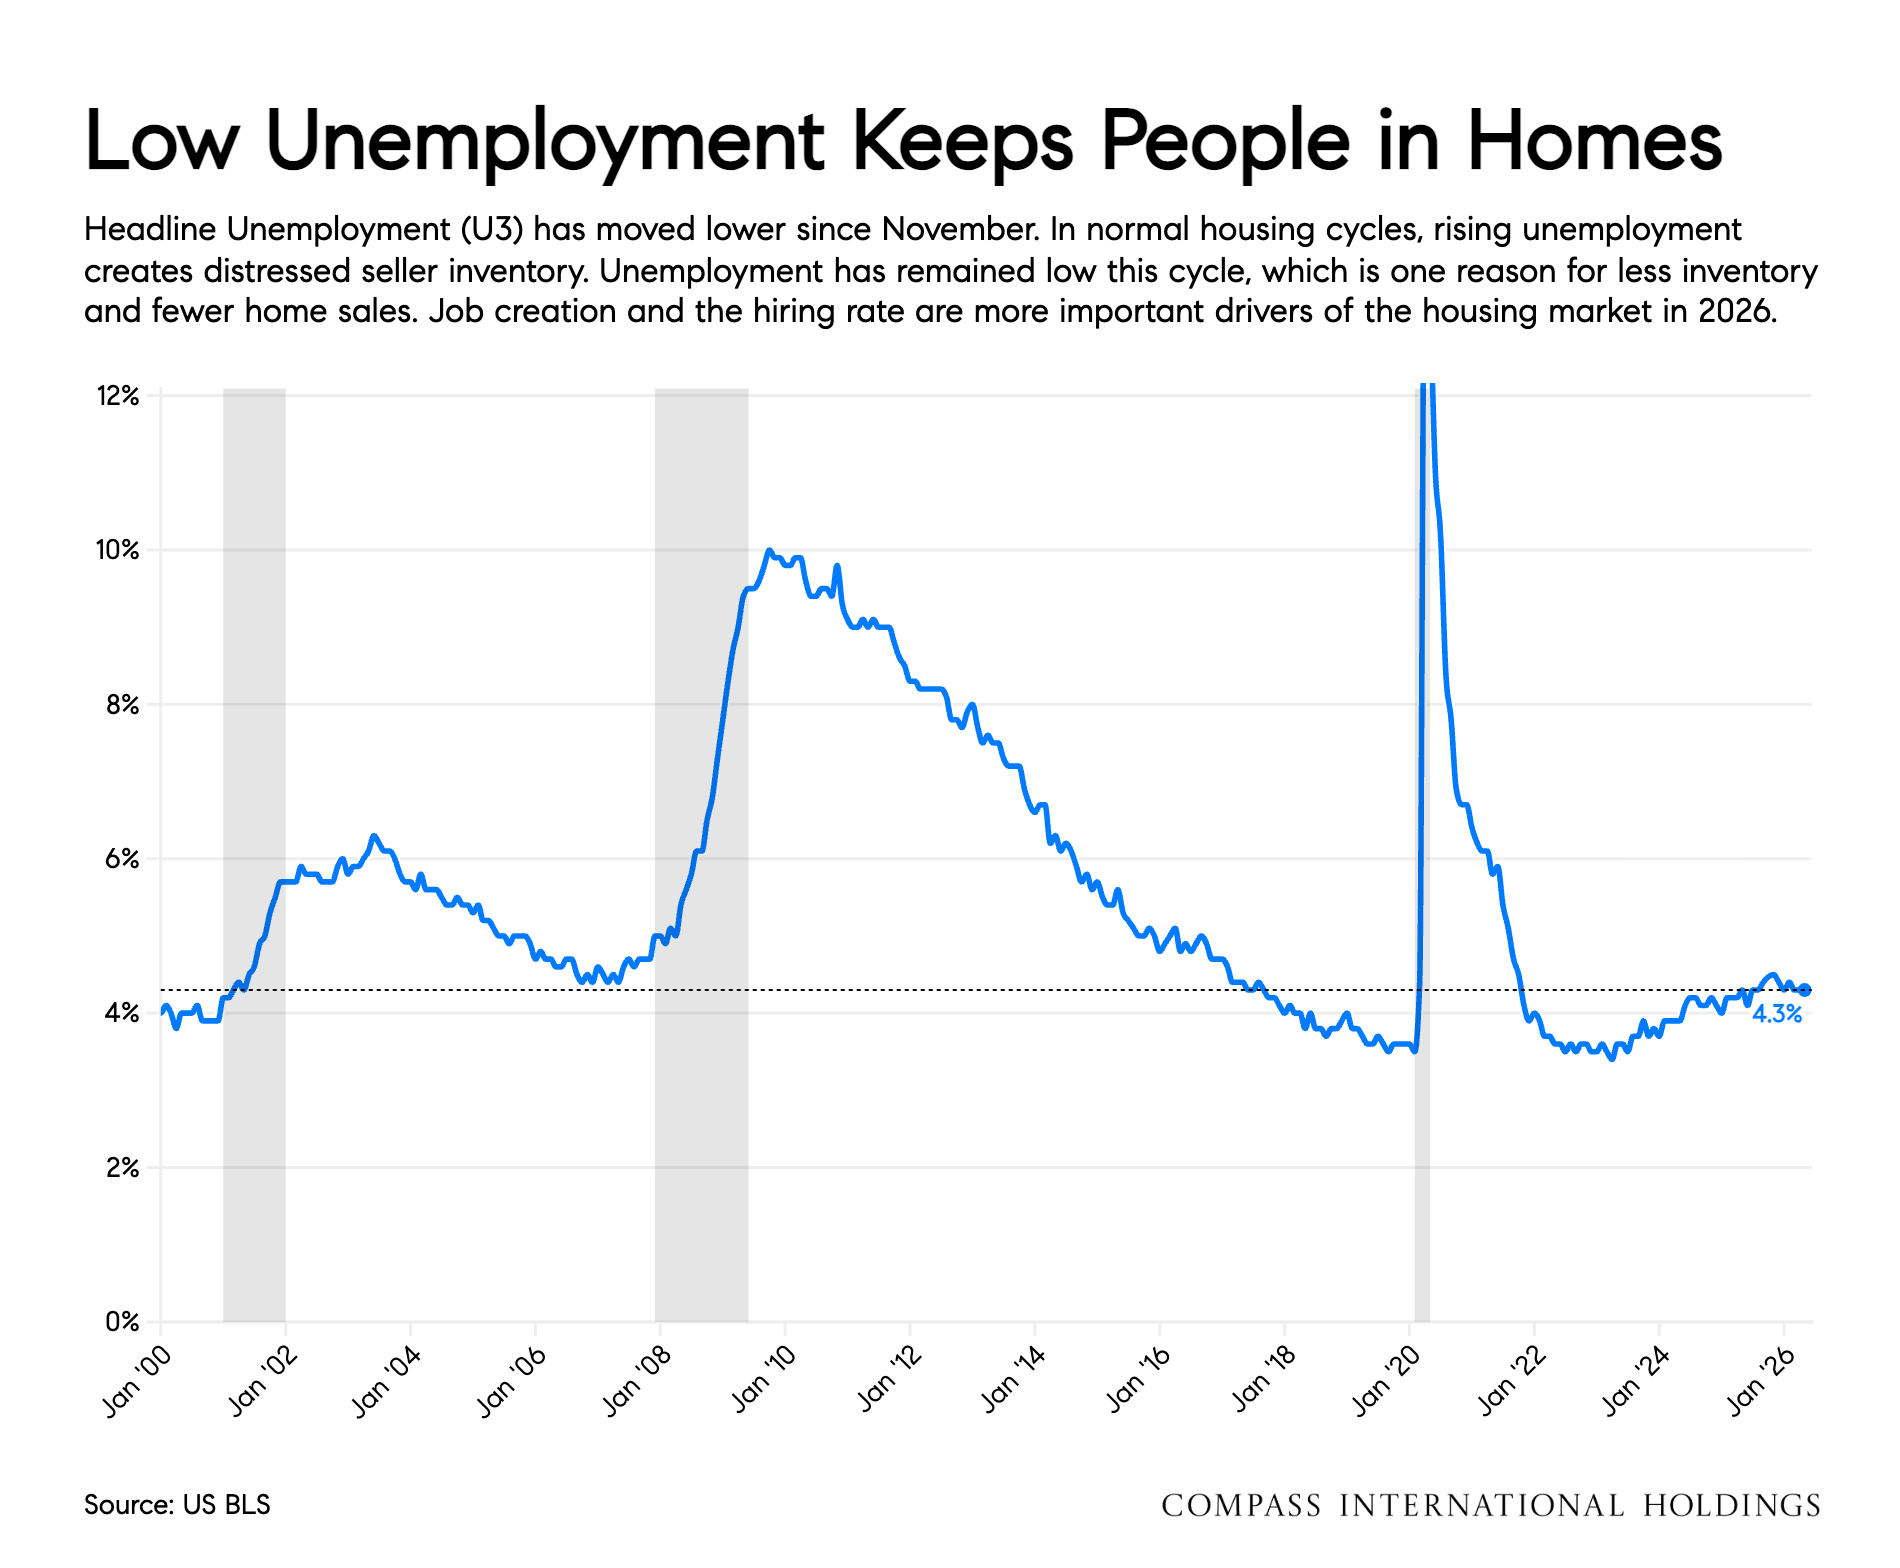
Chart of U.S. unemployment from 2000 to 2026, ending at 4.3% after sharp peaks in 2009 and 2020.
Bar chart of quarterly foreclosures, peaking at 566.2K in 2009 and reaching 59.2K in 2026.
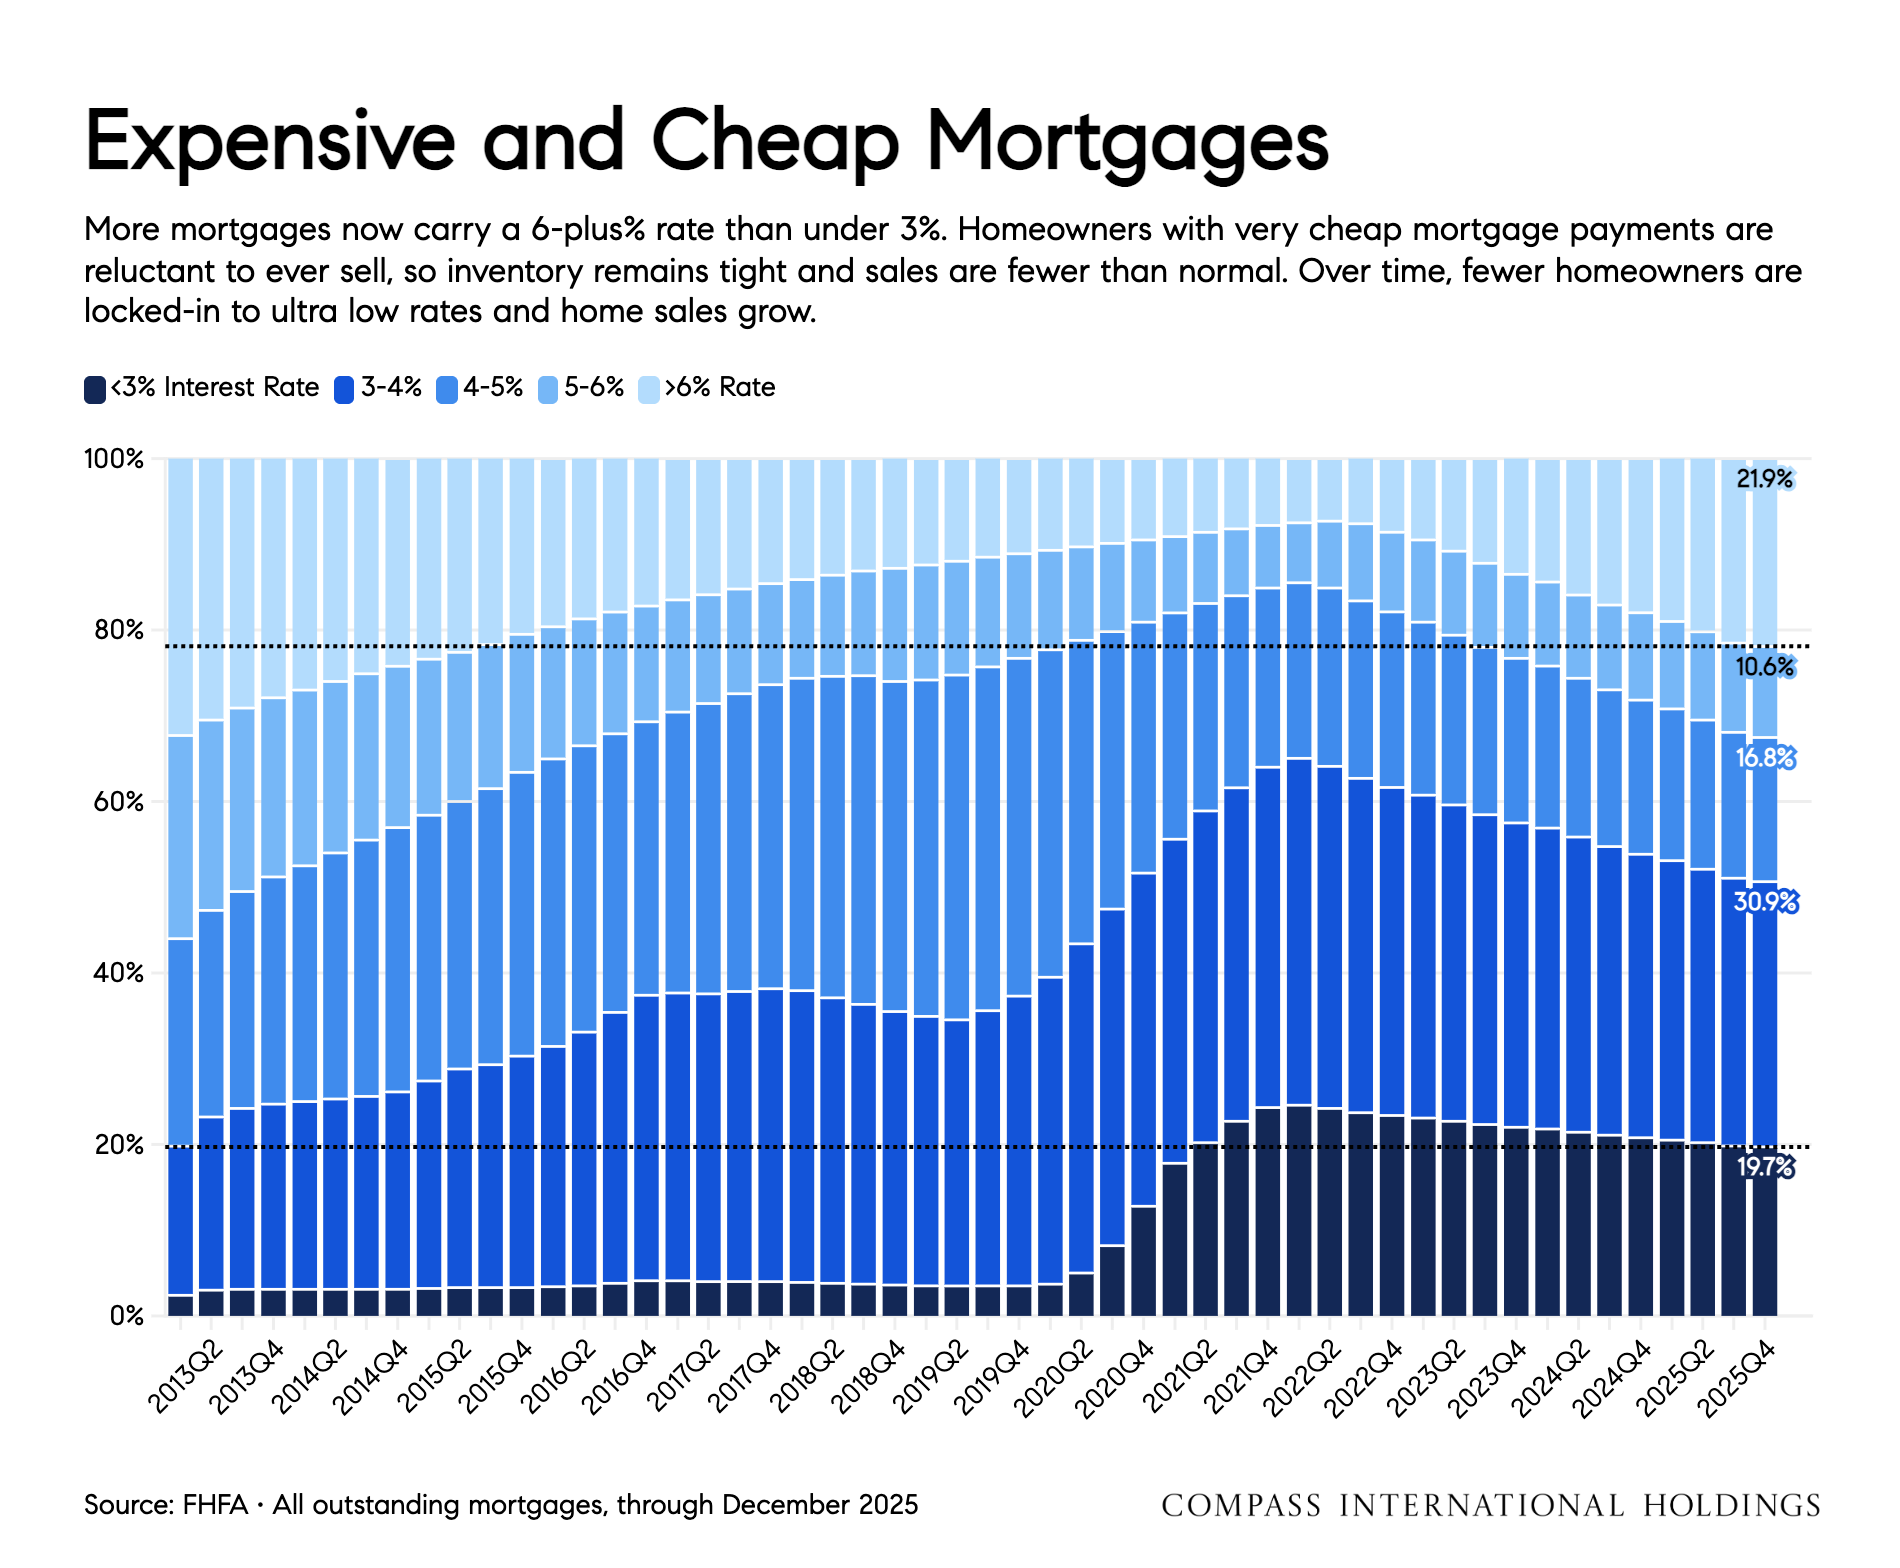
Chart of outstanding mortgage interest rates by rate range, from 2013 Q2 to 2025 Q4.
San Francisco neighborhood map showing changes in median single-family home prices compared with 2025.
Chart compares single-family home price changes across ten Bay Area counties; San Francisco is highlighted in purple.
Line chart of San Francisco single-family home prices, with May 2026 reaching a record $2.2 million.
San Francisco single-family home price and closed-sales chart, with prices reaching $2.2 million in June 2026.
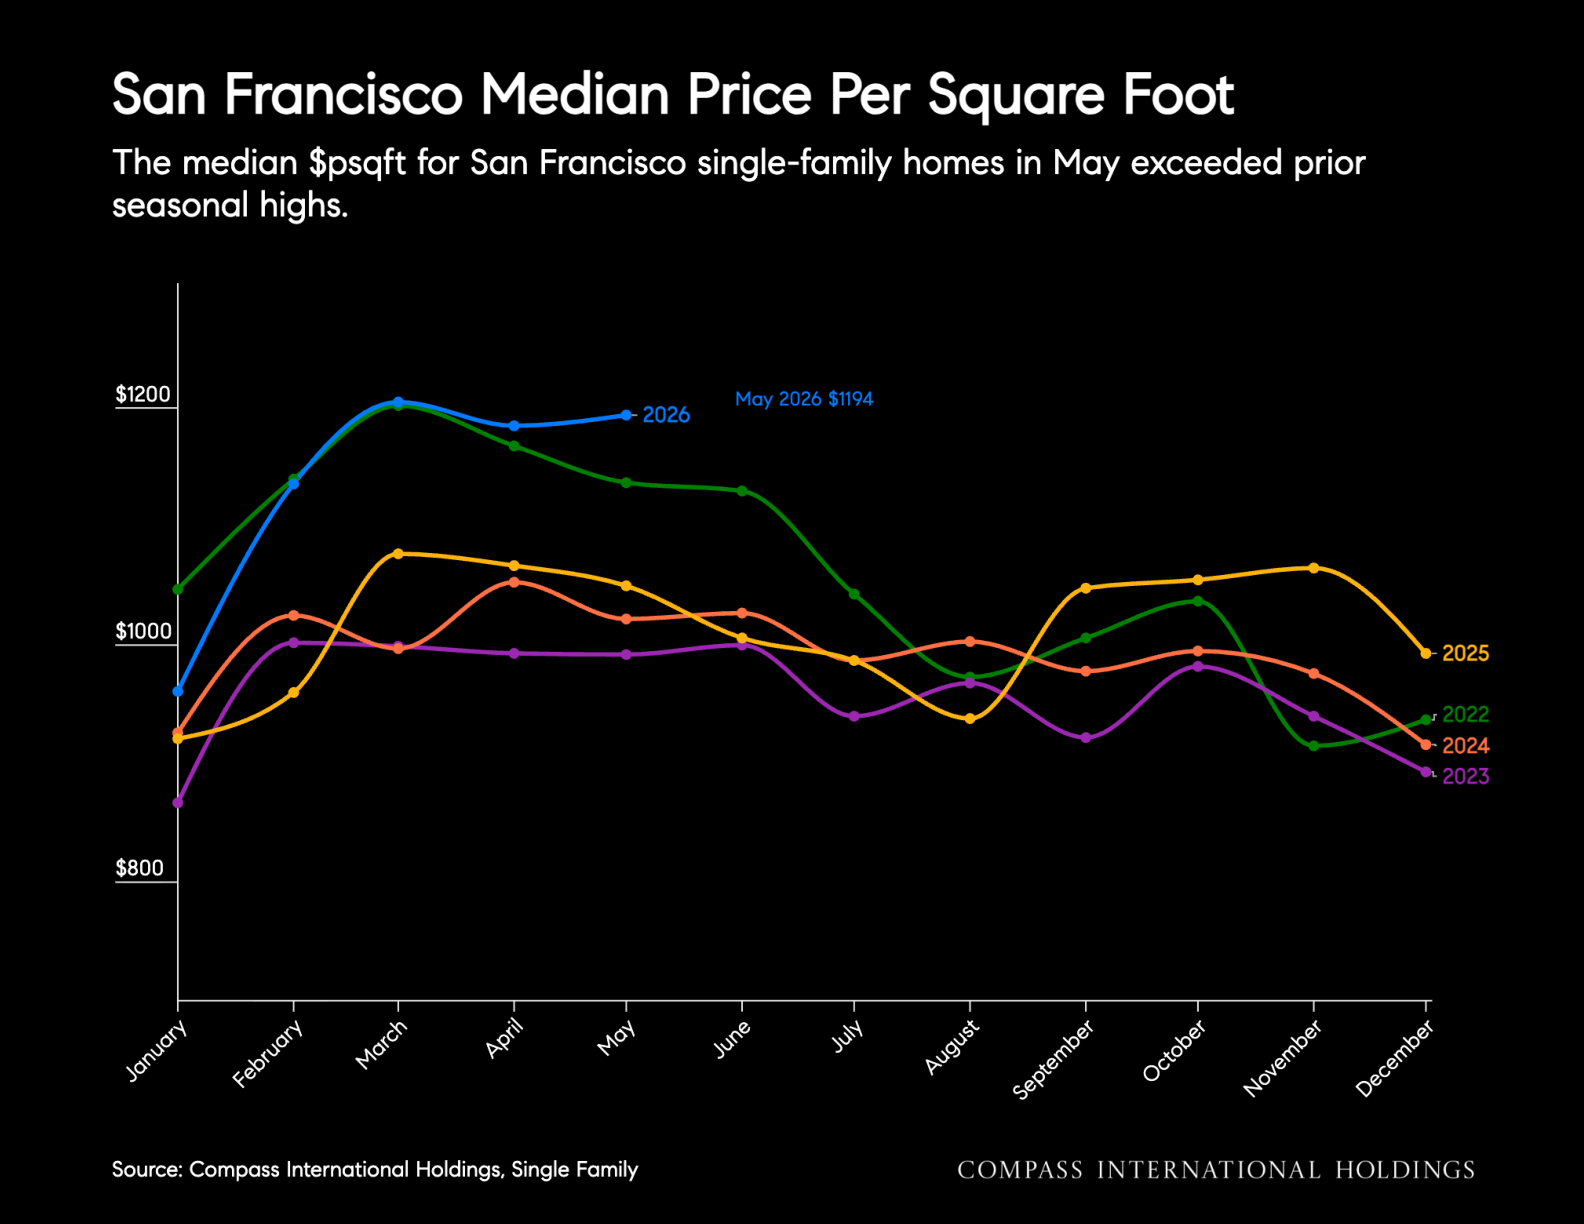
Chart of San Francisco single-family home median price per square foot by month, comparing 2022–2026; May 2026 is $1,194.
San Francisco single-family home price-per-square-foot and median-square-foot chart, February 2021 to May 2026.
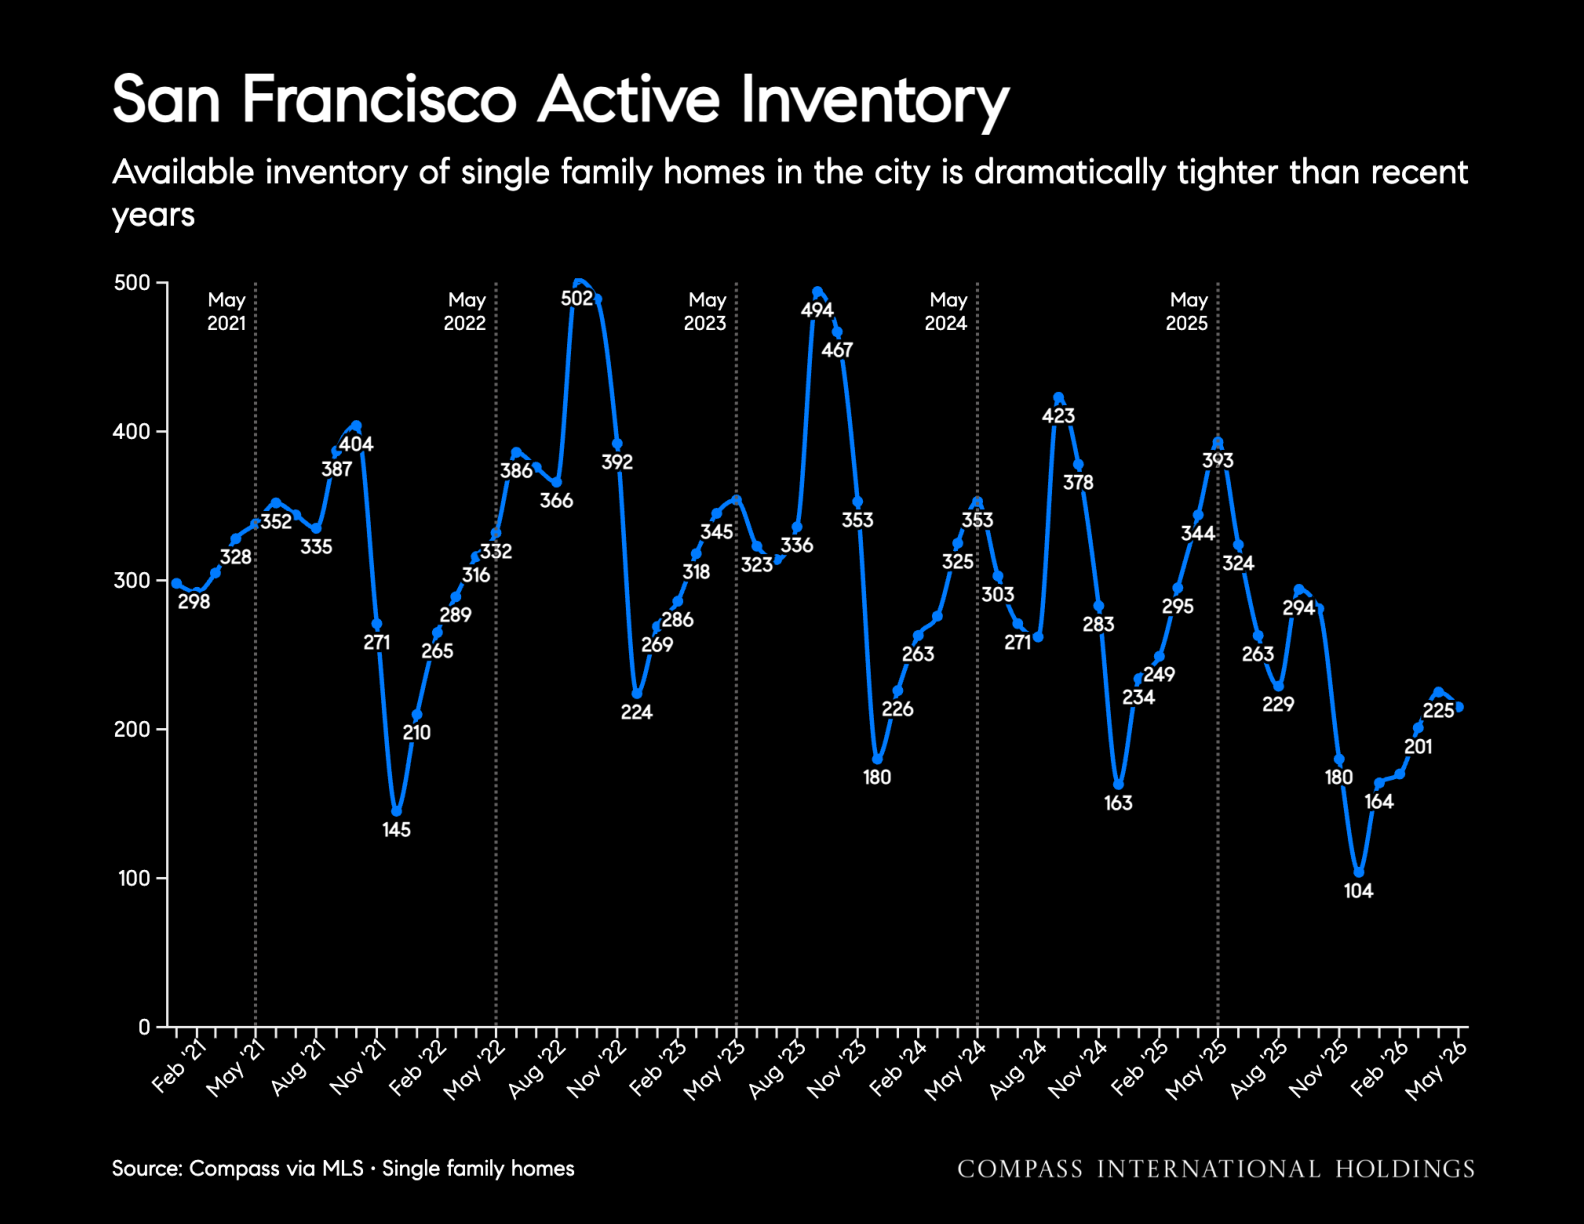
San Francisco single-family home inventory and pending sales chart, May 2024–May 2026.
San Francisco single-family home market chart: sold price-to-list percentages and price reductions, May 2024–May 2026.
San Francisco days-on-market chart: May 2026 shows 18 days for SFRs and 39 days for condos.
Line chart compares monthly average days on market for San Francisco single-family homes from 2022 through May 2026.
Table comparing single-family home prices, sales, pending sales, and square footage across 12 San Francisco neighborhoods.
San Francisco neighborhood housing market table with prices, sales figures, and highlighted rows.
Chart of San Francisco median condo prices by month from 2022 to 2026; May 2026 is $1.33 million, up 3%.
Chart of San Francisco condo prices and closed sales, with May 2026 median price at $1.33 million and 267 sales.
San Francisco condo chart shows price per square foot rising to $1,166 in May 2026, with median size at 1,149 square feet.
San Francisco condo inventory chart, fluctuating from 2021 to 2026 and ending at 584 active listings.
Chart of San Francisco condo active listings and pending sales from May 2024 to May 2026.
Chart of San Francisco condo price reductions and sold-to-list price percentages from 2021 to 2026.
Line chart comparing monthly San Francisco condo days on market from 2022 to 2026; 2026 reaches 39 days in May.
San Francisco condo market table with neighborhood prices, sales, pending listings, and median square footage.
San Francisco neighborhood condo market table comparing prices, sales, pending listings, and median square footage.

Recent Review

"Ron was amazing to work with, selling my house in San Francisco. He knew exactly what we needed to do to maximize the sales price, had the right connections to bring in people to stage the house and make the small fixes that were needed, and knew how to price the house. In addition, Ron was always available for questions and was a pleasure to work with. I have already recommended Ron to a friend of mine for her real estate needs." - Seller SZ


June 2026

Active Listings

Inner Mission

45 Bartlett St, Unit 602, 94110

1 BD 1 BA 845 SF $975,000

Bright modern living room with a leather sectional, midcentury furniture, and large windows.

Duboce Triangle

2238 Market St, Unit 407, 94114

2 BD 2 BA 1142 SF $1,420,000

Recent Sales

Bright living room with sculptural brown chairs, round wood coffee table, and marble-patterned kitchen island.

Duboce Triangle

307 Castro St, Unit 2, 94114

2 BD 2 BA 1525 SF $1,950,000

SOLD OFF-MARKET

Modern narrow gray multi-story home behind a gated entrance, with large grid windows and a garage.

Lone Mountain

2686 McAllister St, Unit 2, 94118

3 BD 3 BA 1846 SF $2,200,000

SOLD

Smiling man in a dark suit and tie against a light background.

Ron Salter


DRE #: 01989381

REALTOR®

M: 415.717.8752

[email protected]

Montgomery + LEE

Compass is a real estate broker licensed by the State of California operating under multiple entities. License Numbers 01991628, 01527235, 01527365. All material is intended for informational purposes only and is compiled from sources deemed reliable but is subject to errors, omissions, changes in price, condition, sale, or withdrawal without notice. No statement is made as to the accuracy of any description or measurements (including square footage). This is not intended to solicit property already listed. No financial or legal advice provided. Equal Housing Opportunity. Photos may be virtually staged or digitally enhanced and may not reflect actual property conditions.

Work With Ron

Ron utilizes his local market knowledge to pair a rational, numbers-based approach with a natural ability to listen, communicate, and advise.
Contact
Follow Us