Clients, friends, and colleagues:
Some quick cliff notes on the current state of our market here in San Francisco:
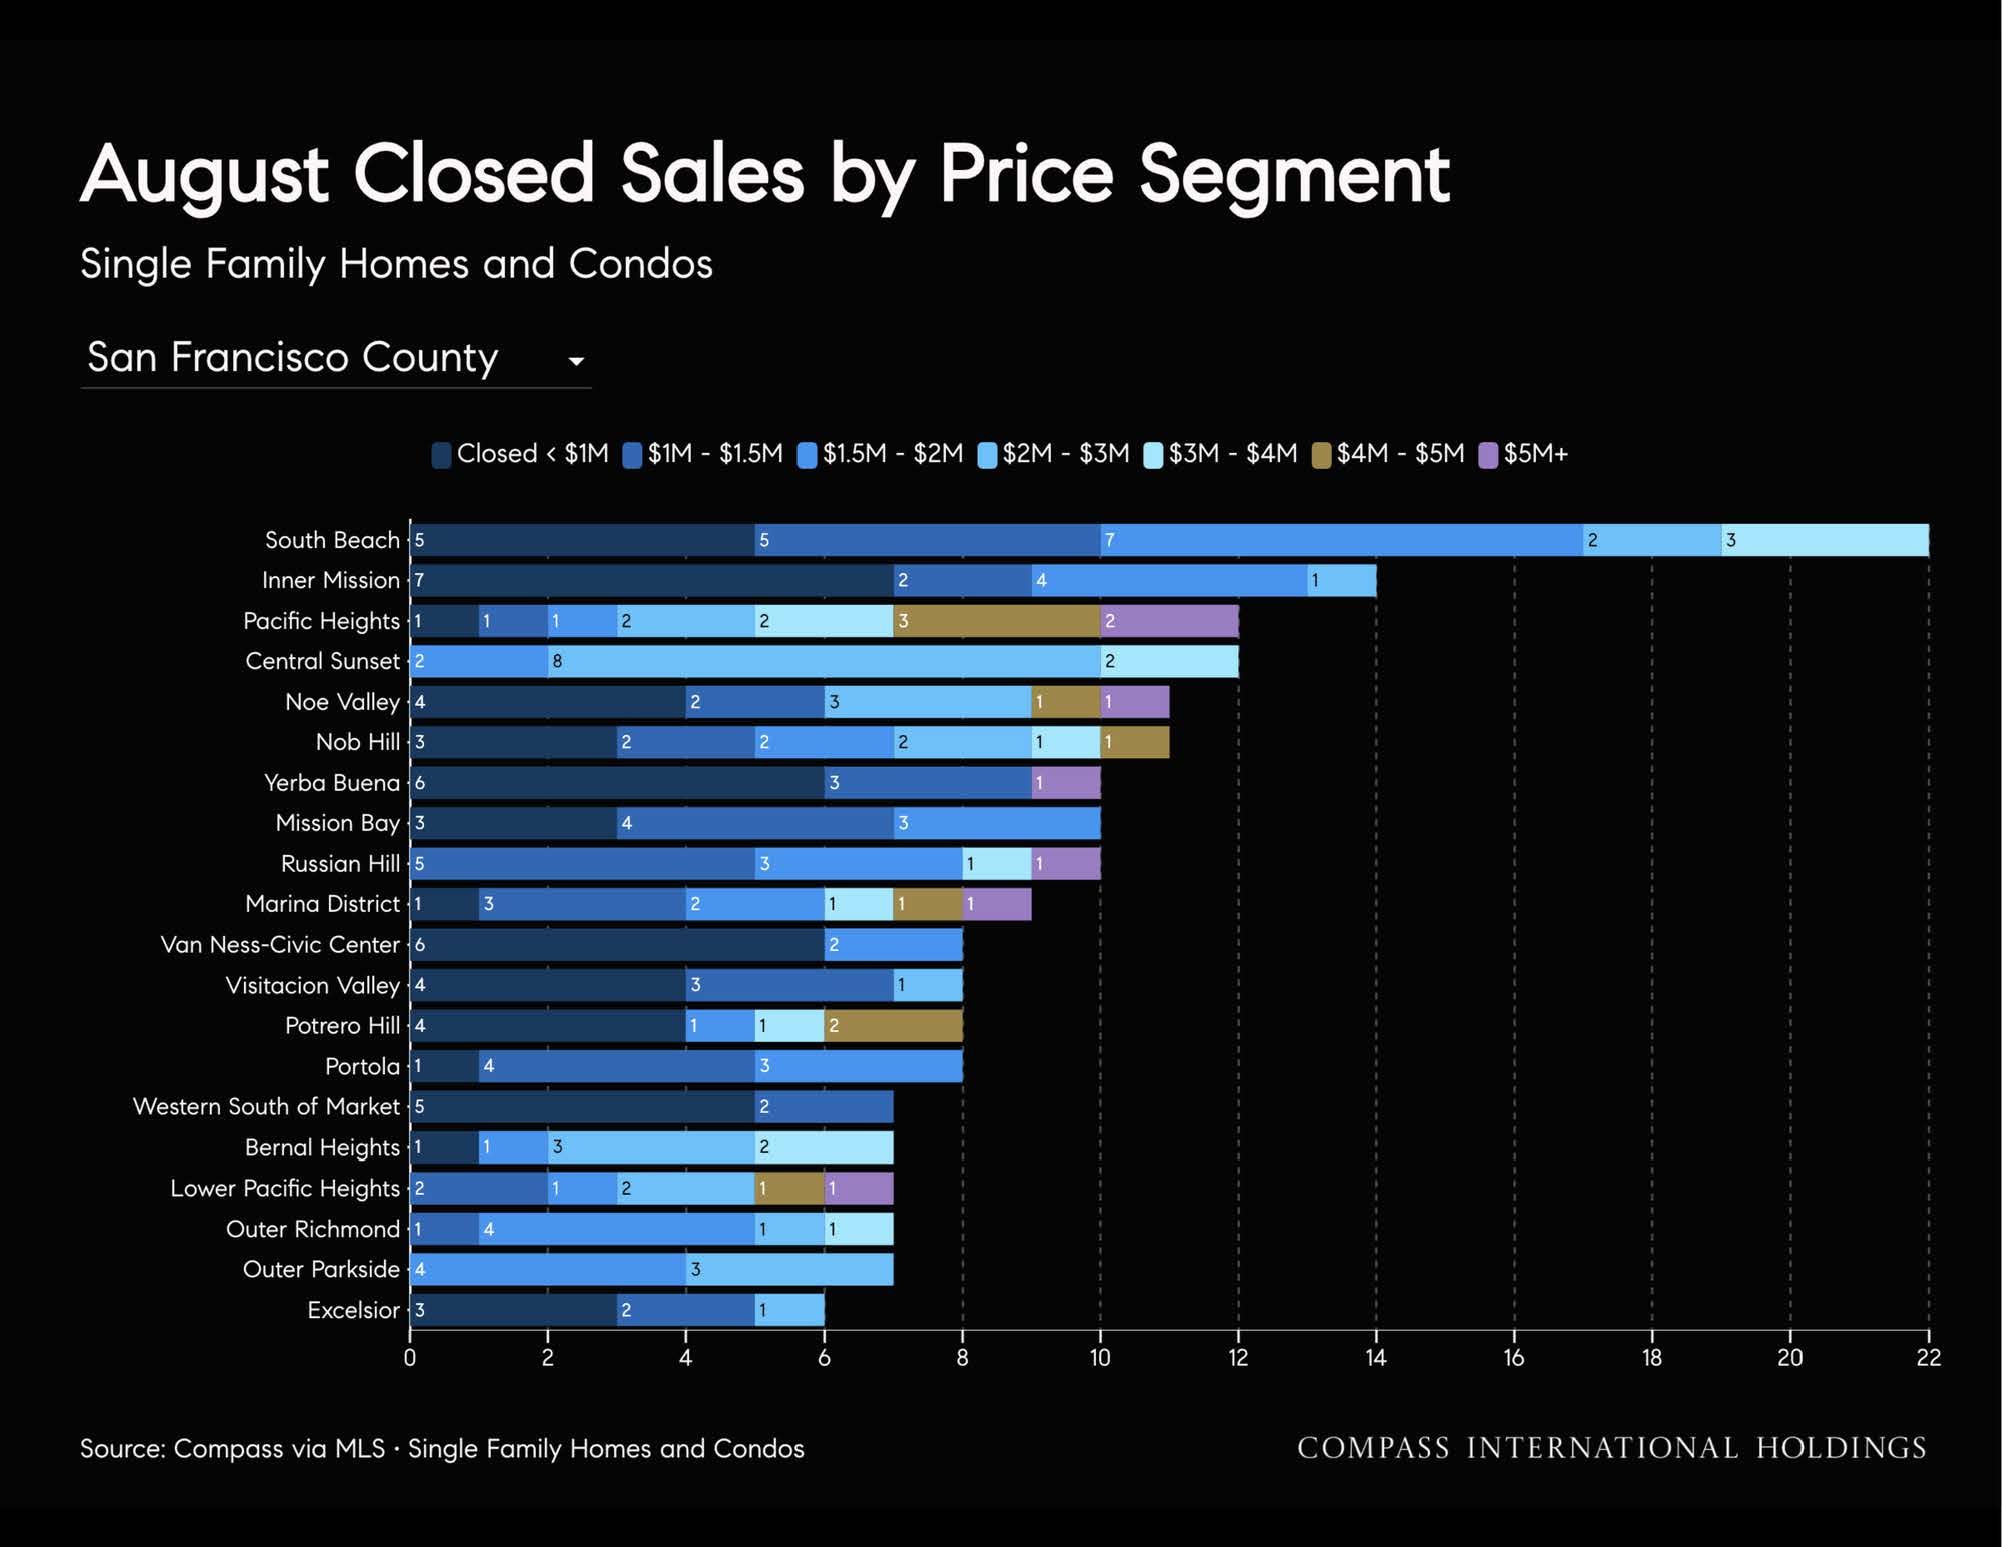
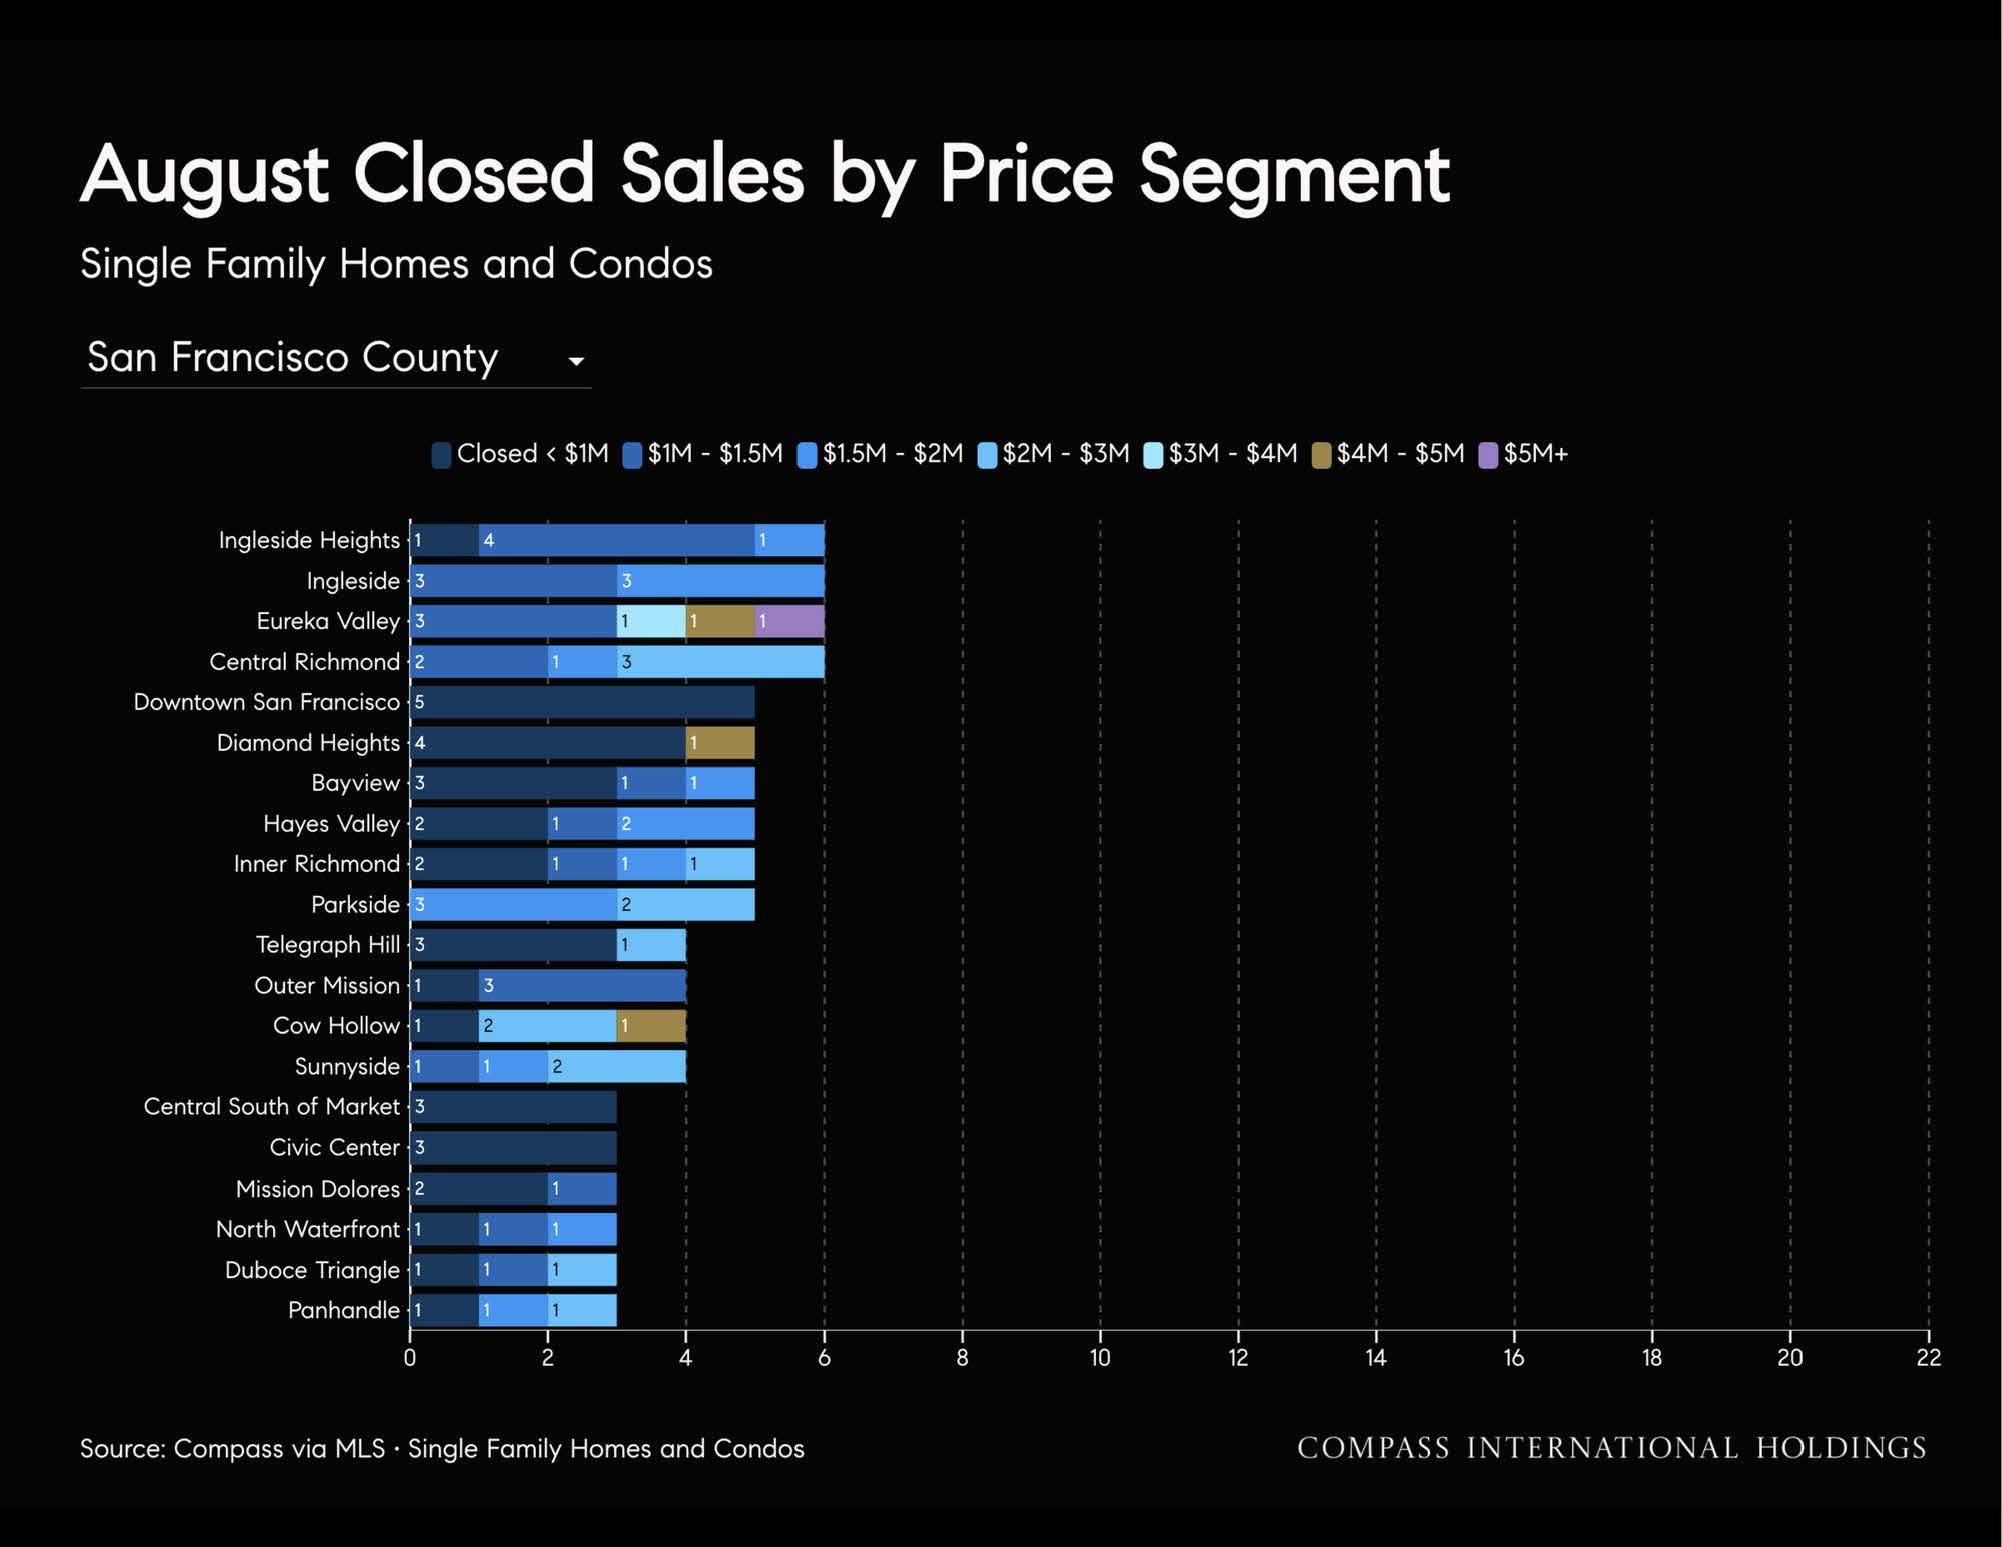
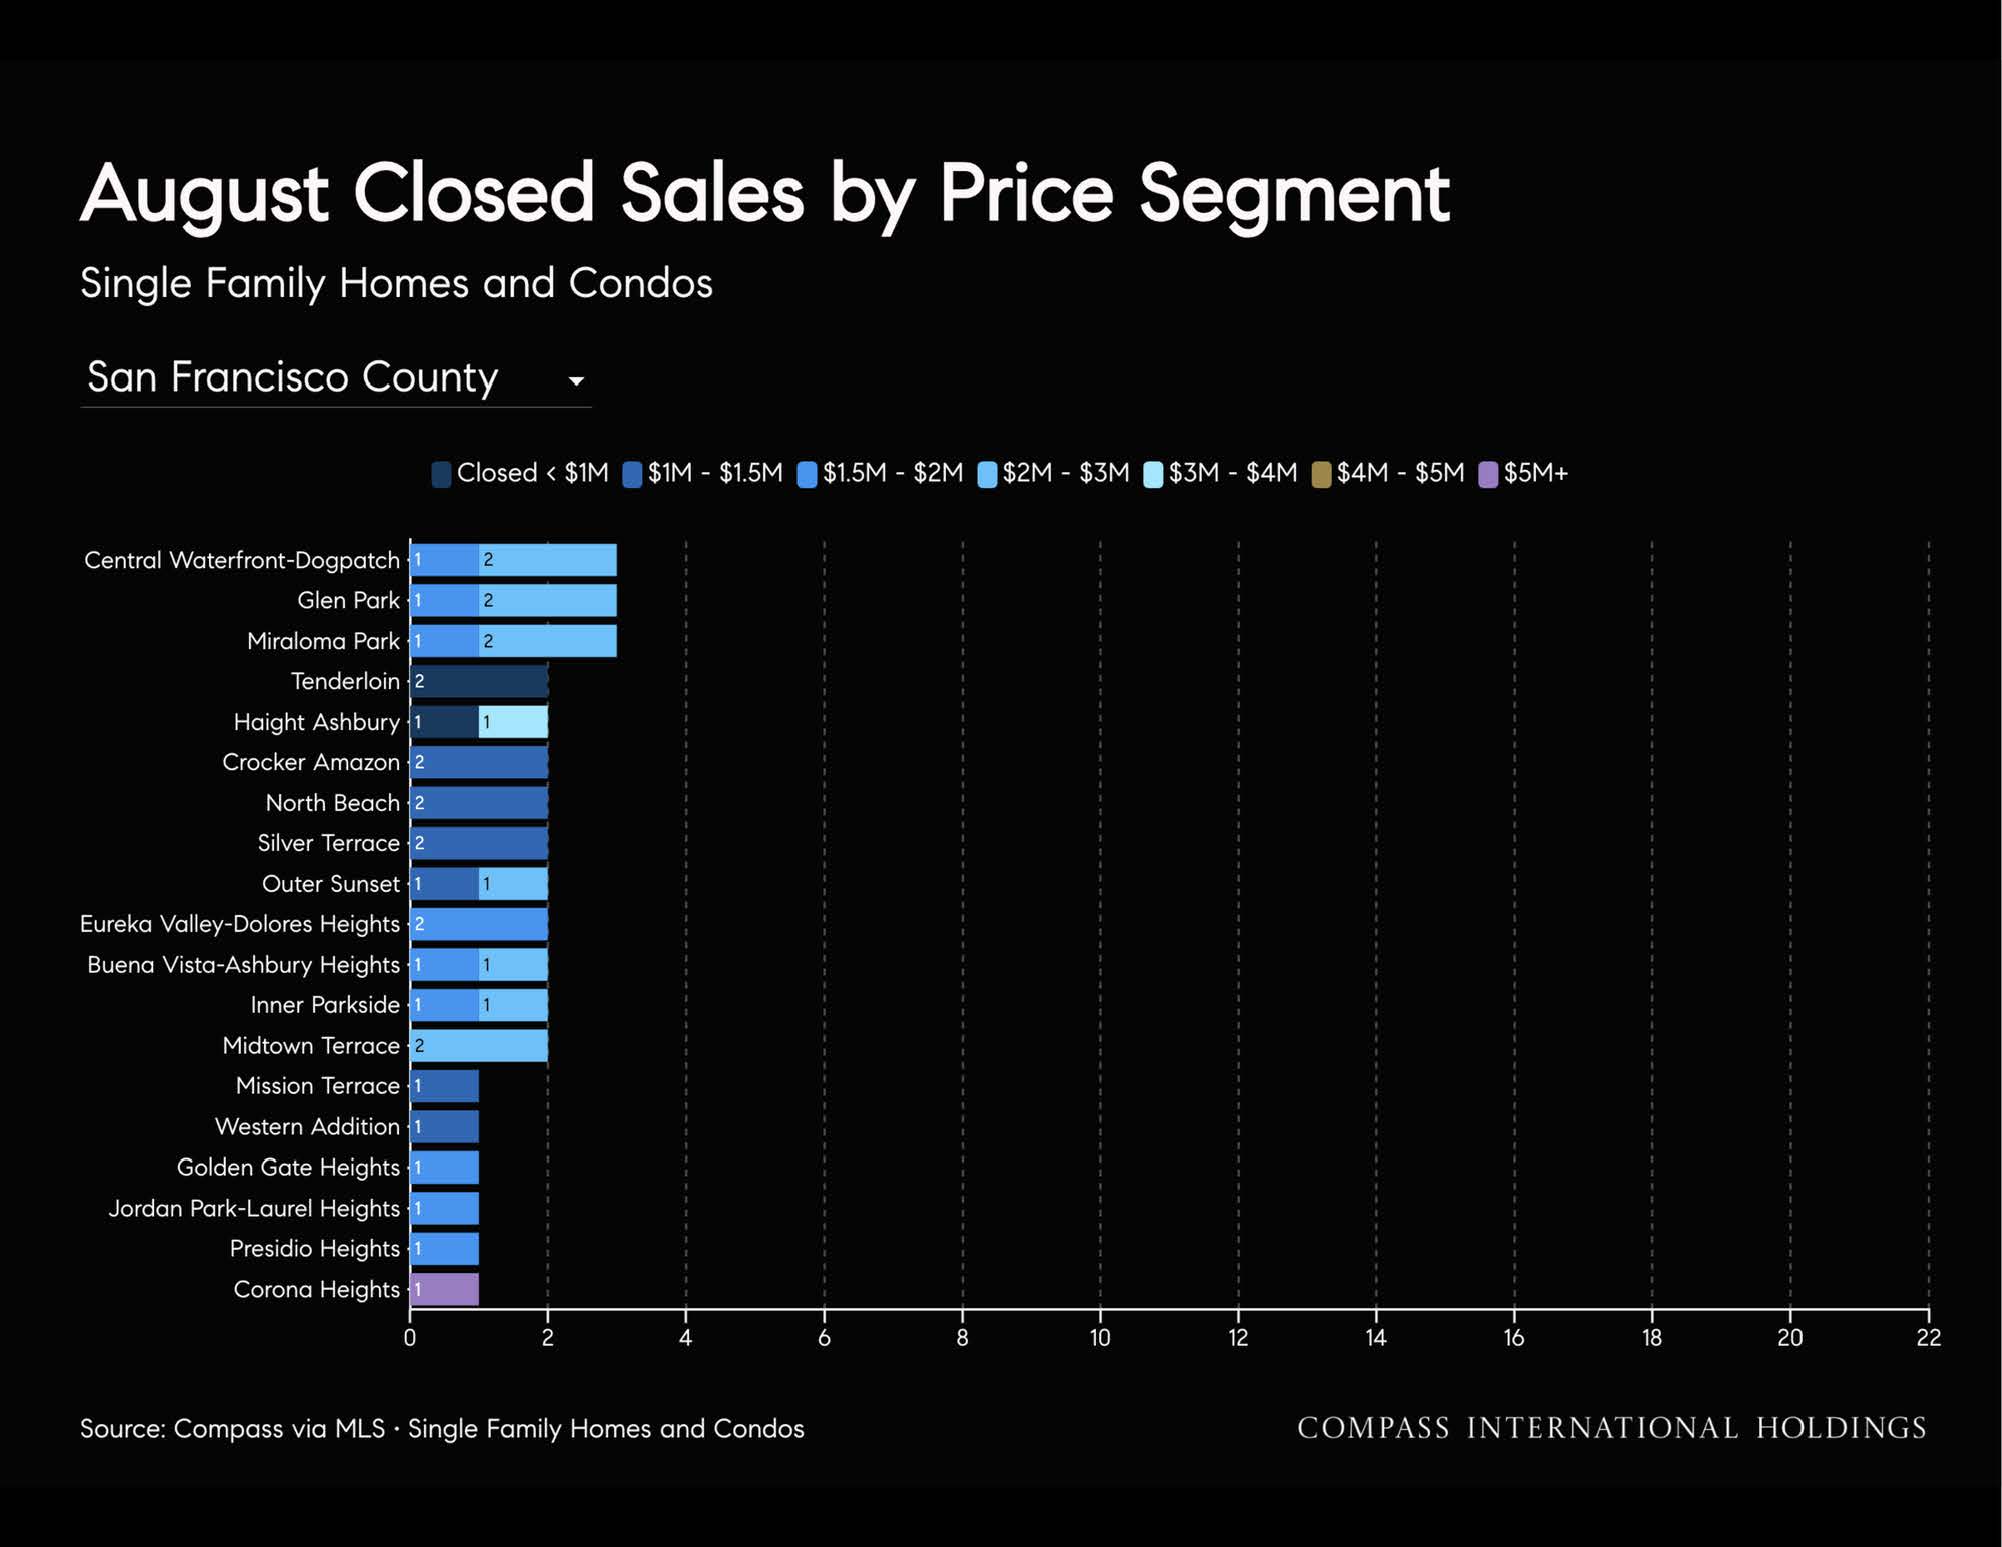
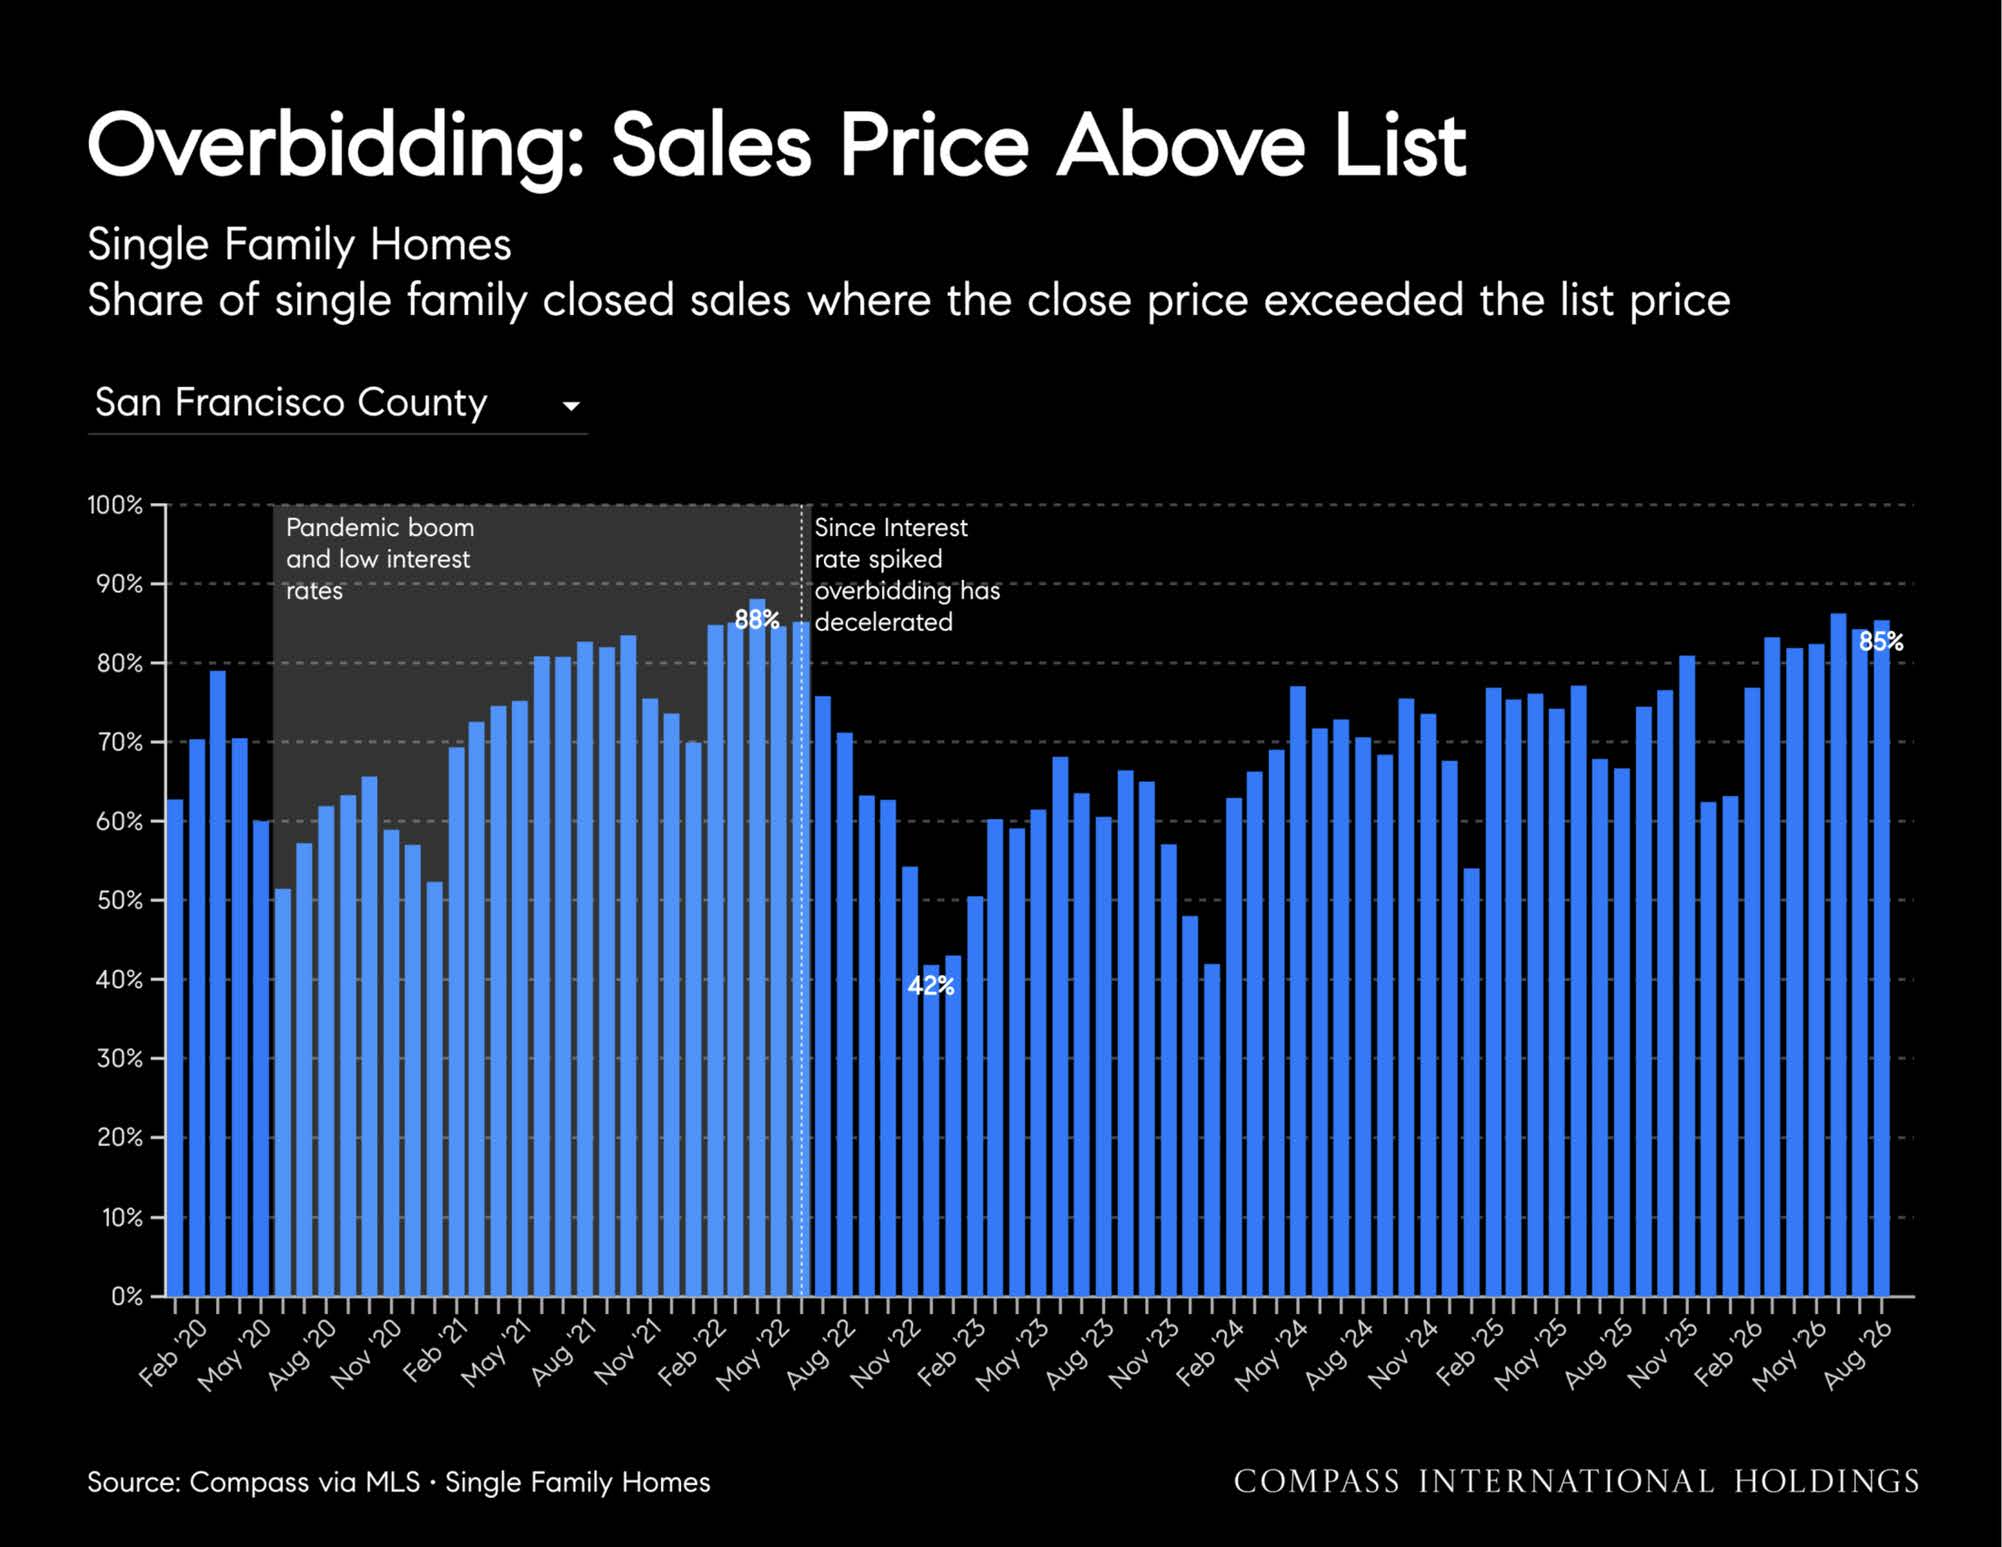
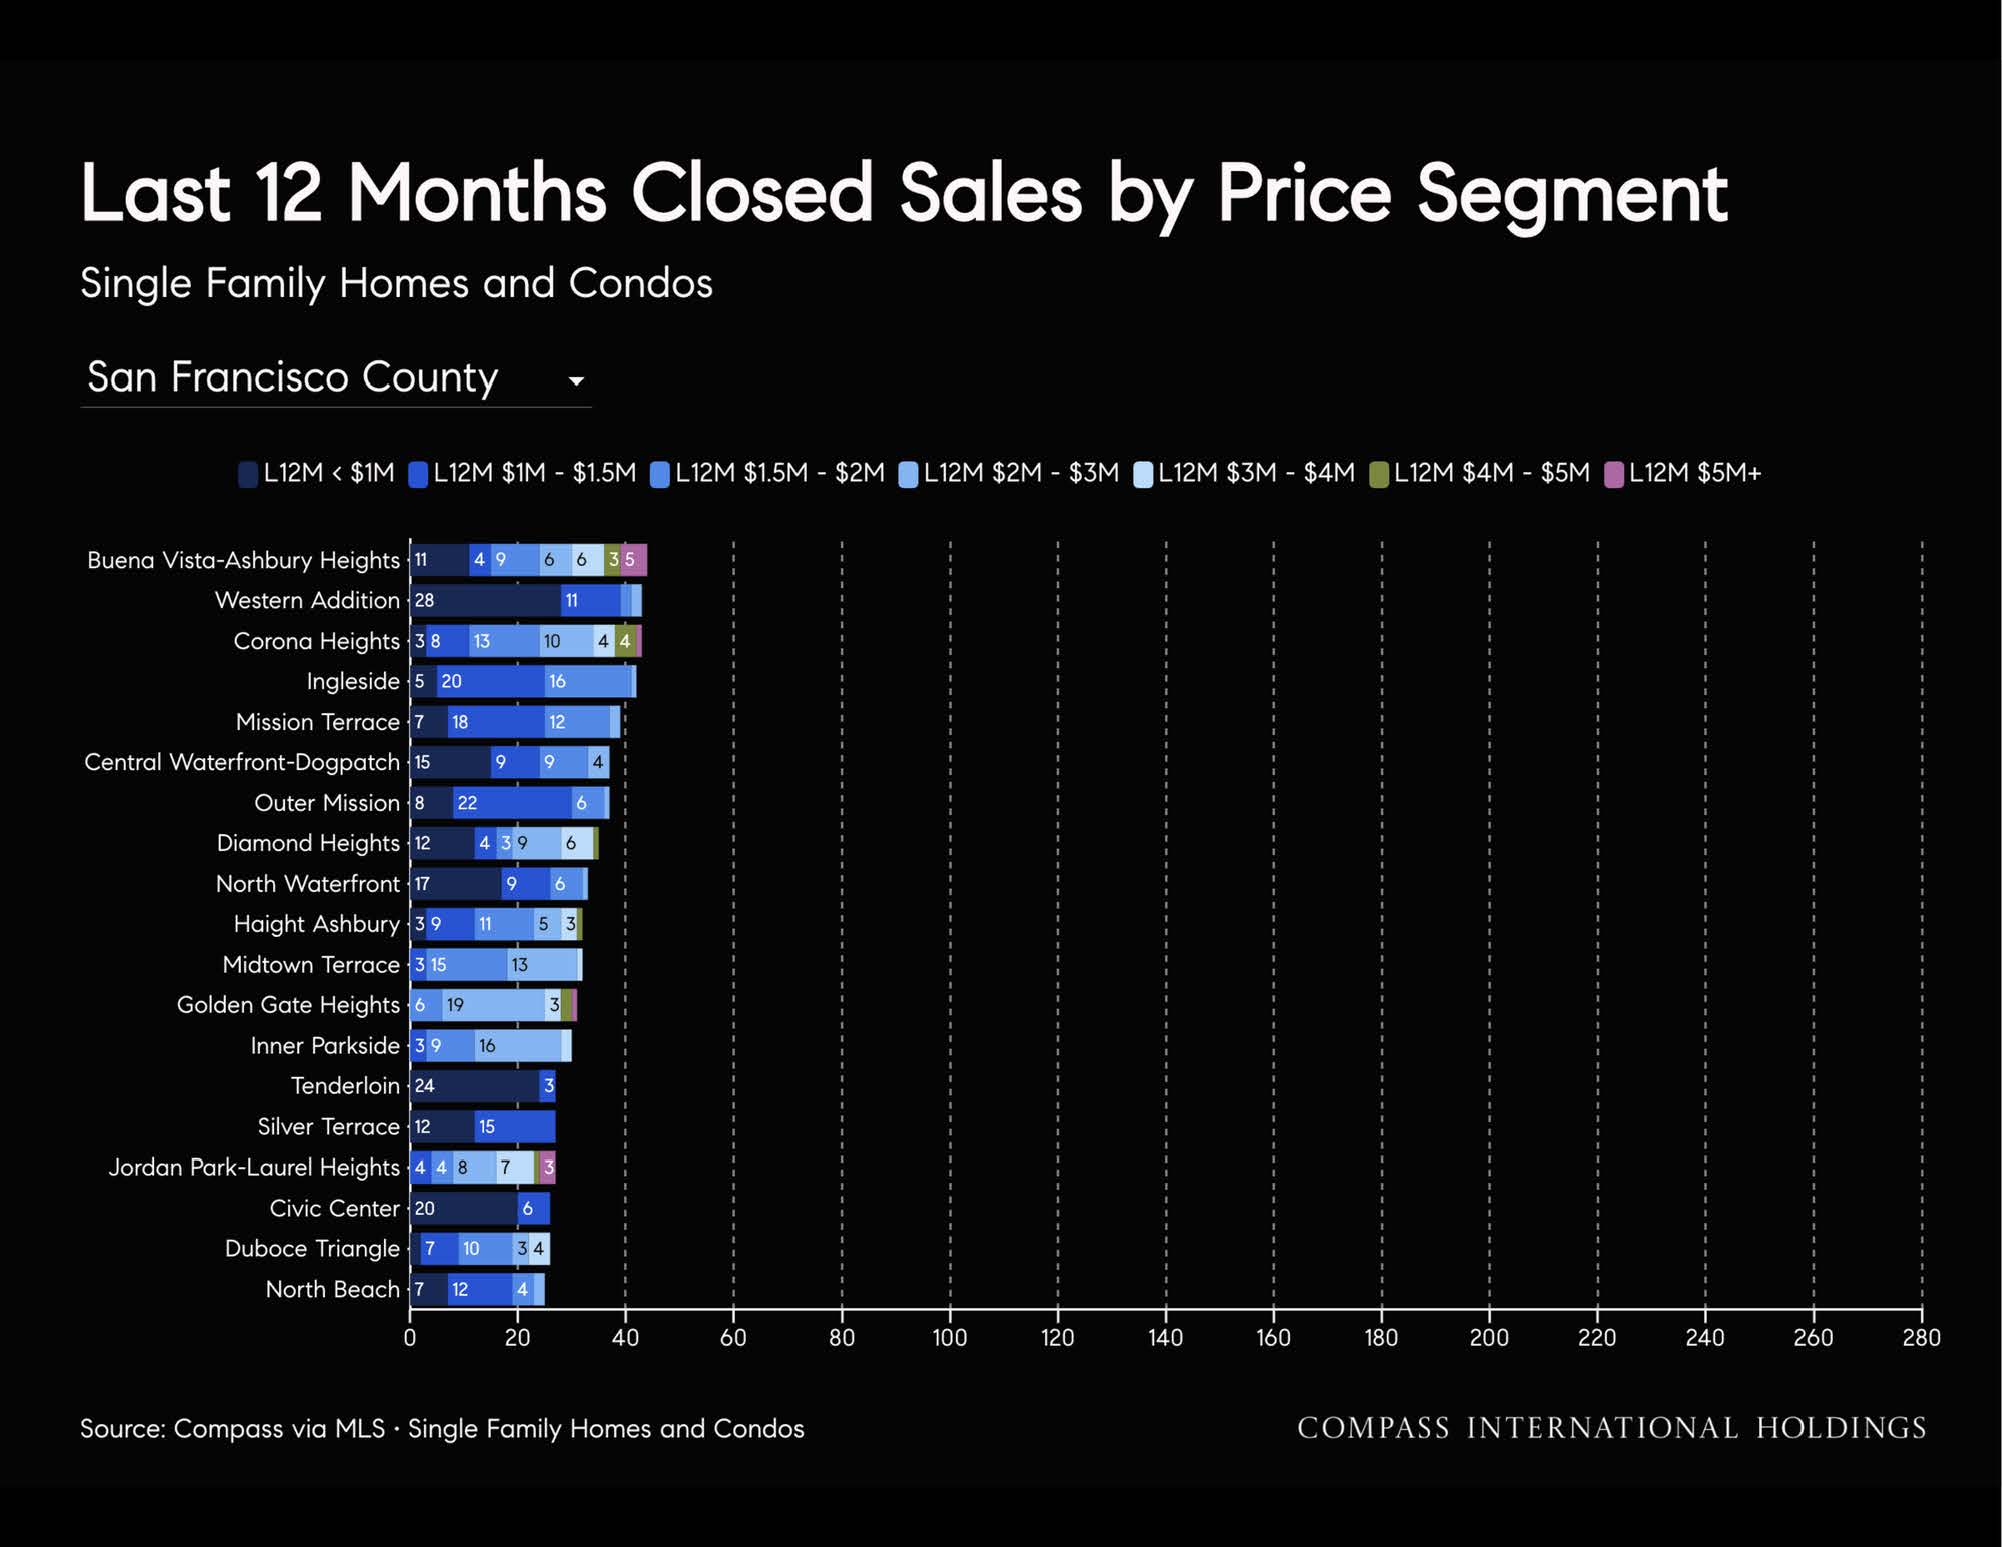
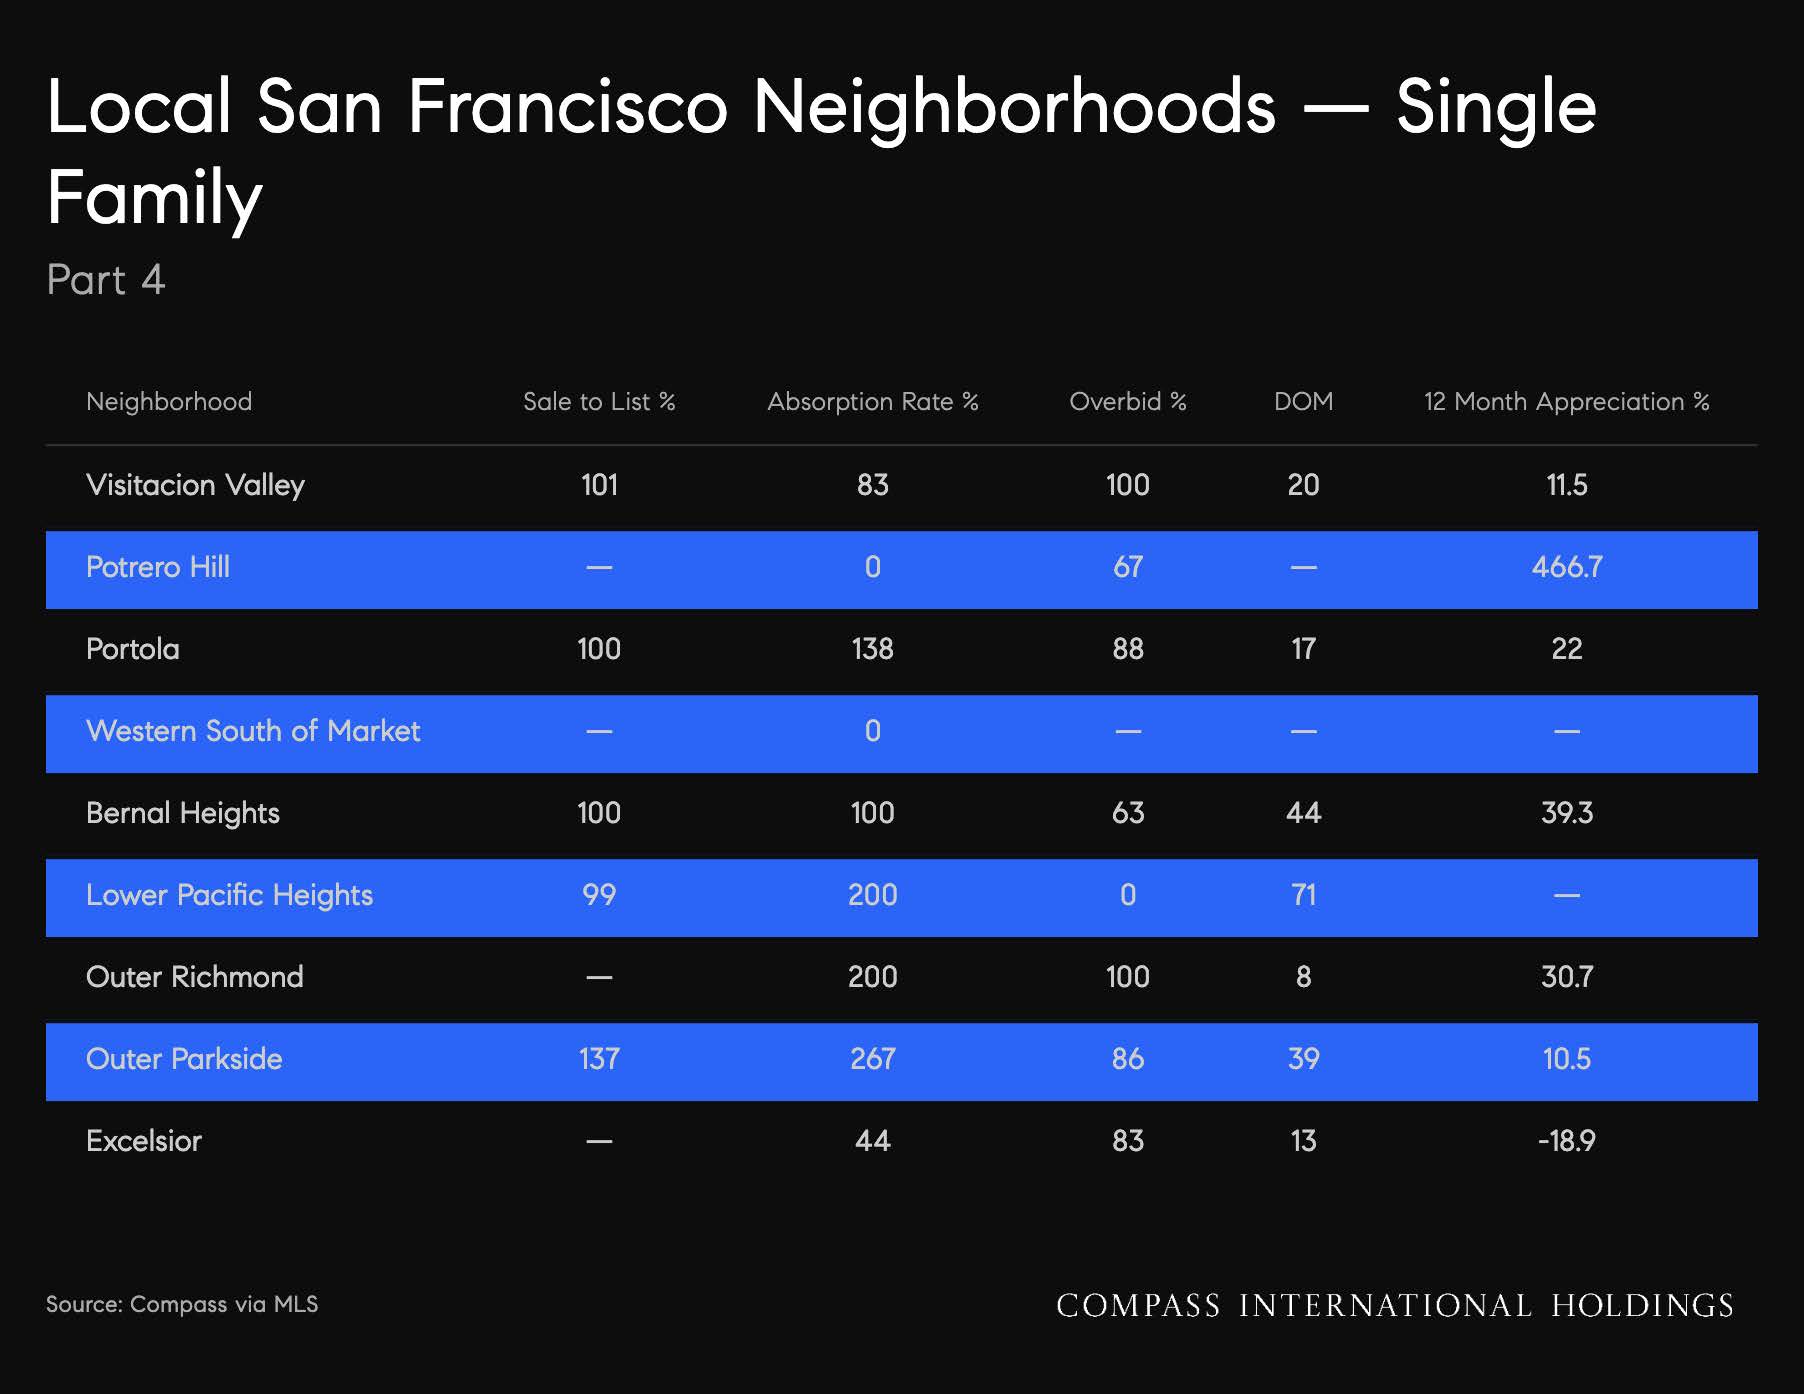
1) The market continues to show robust buyer demand in our hottest sectors (single-family homes and boutique condos throughout the city), with fierce bidding wars and $1M+ over-asking tallies still making the biggest headlines.
2) Rents are up 25%+ in San Francisco, putting added pressure on our purchase market.
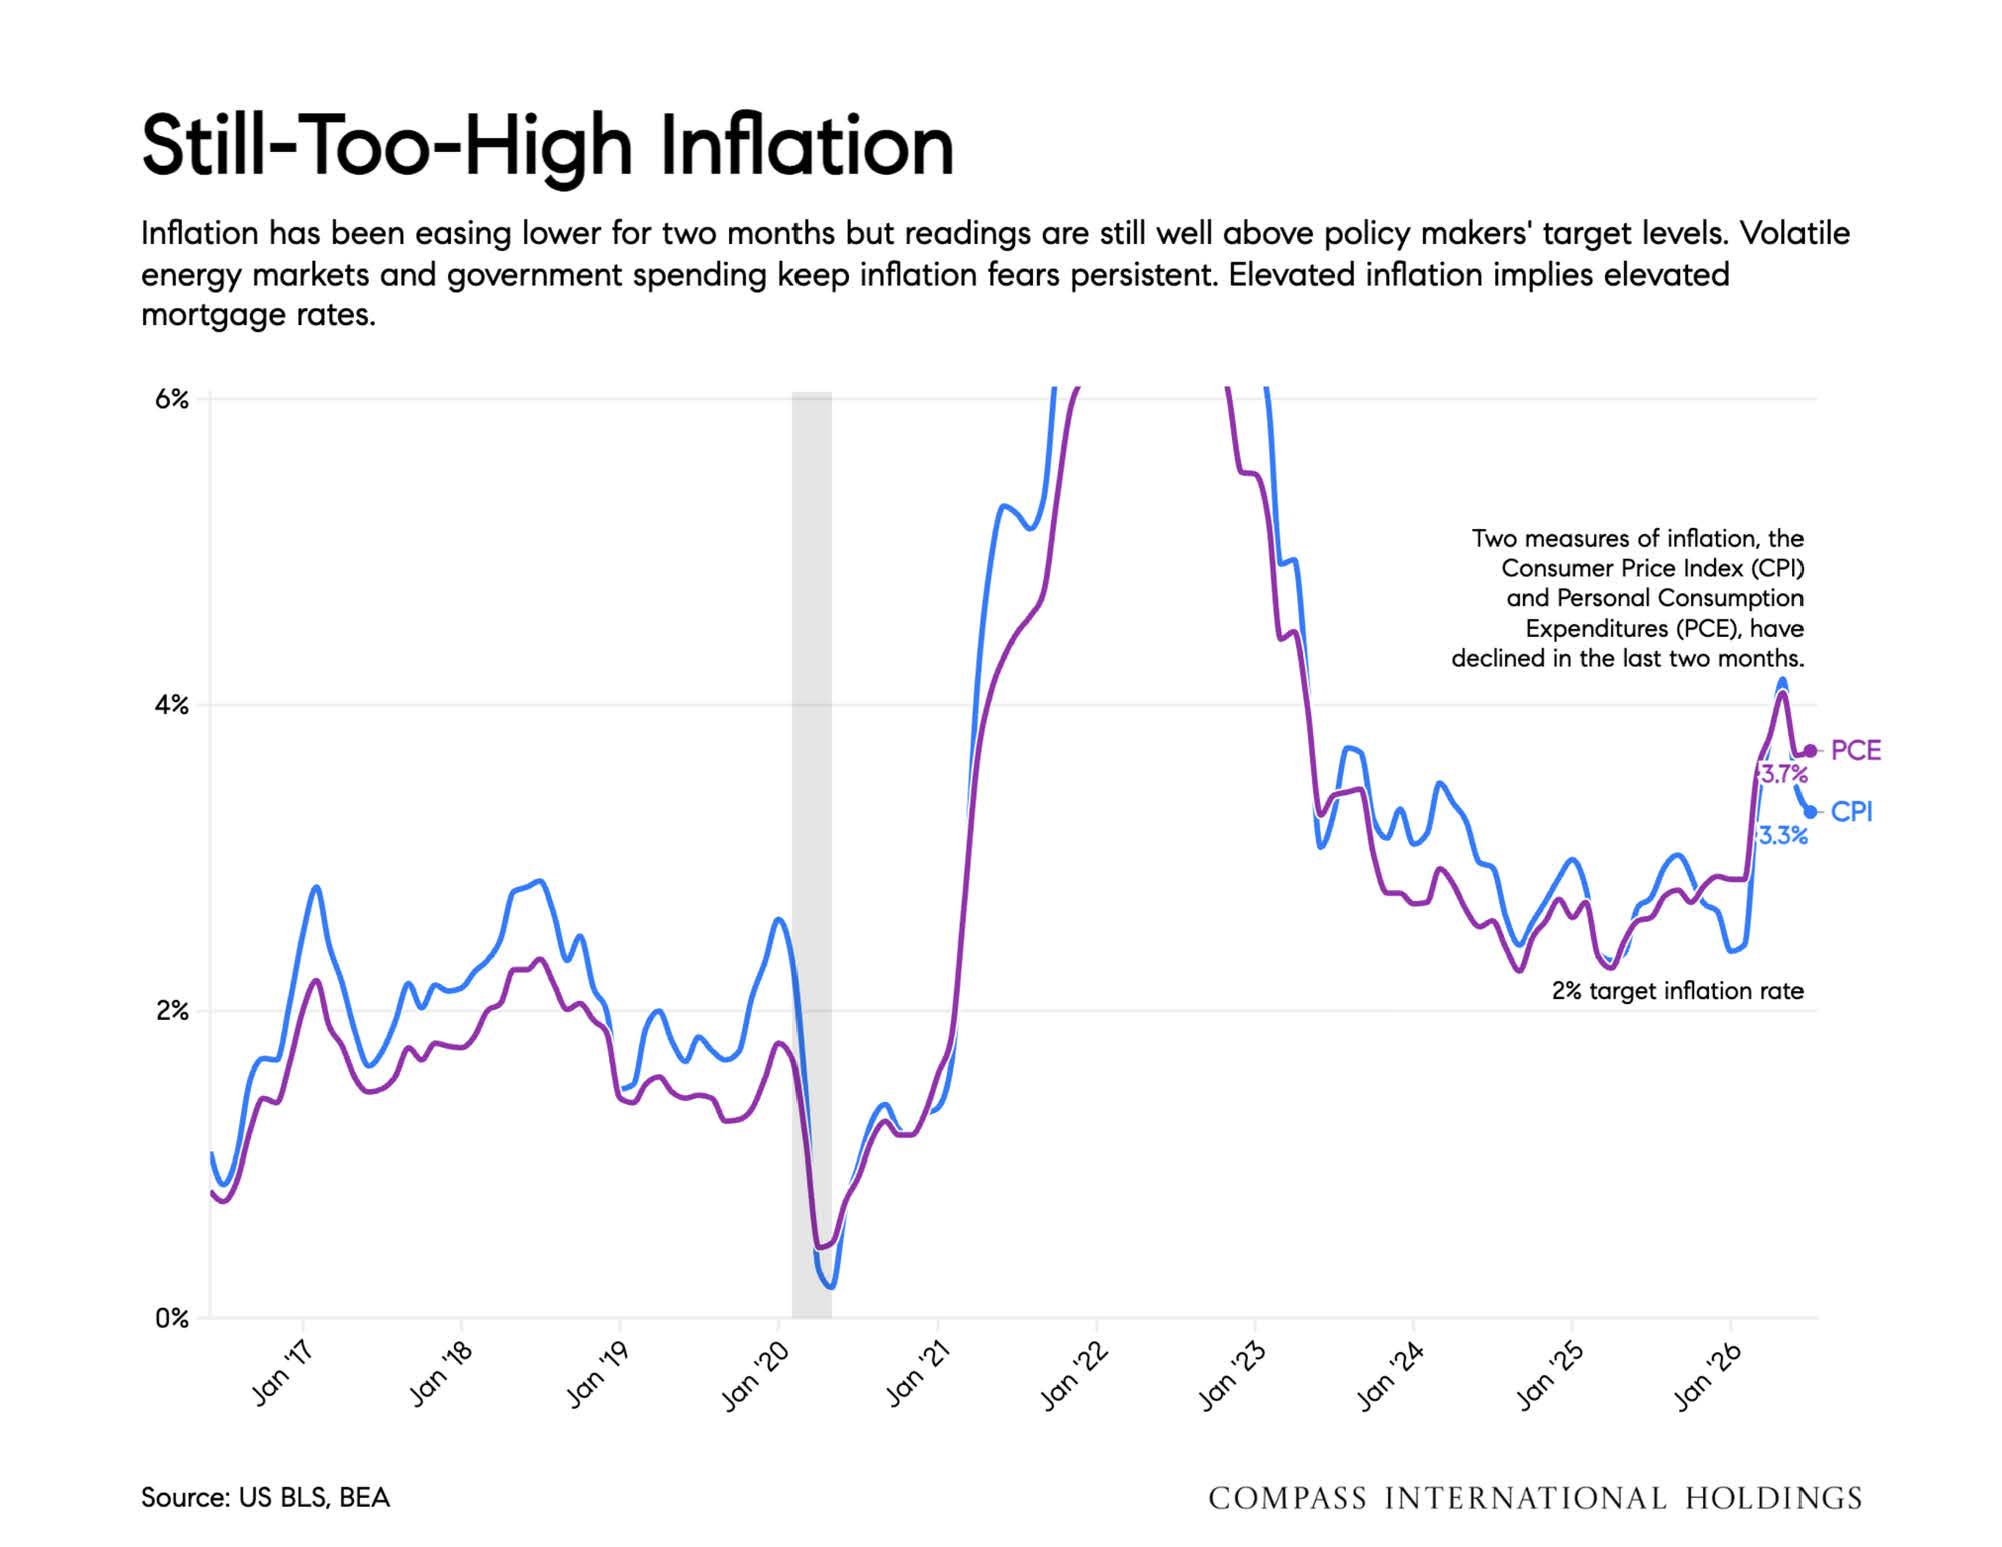
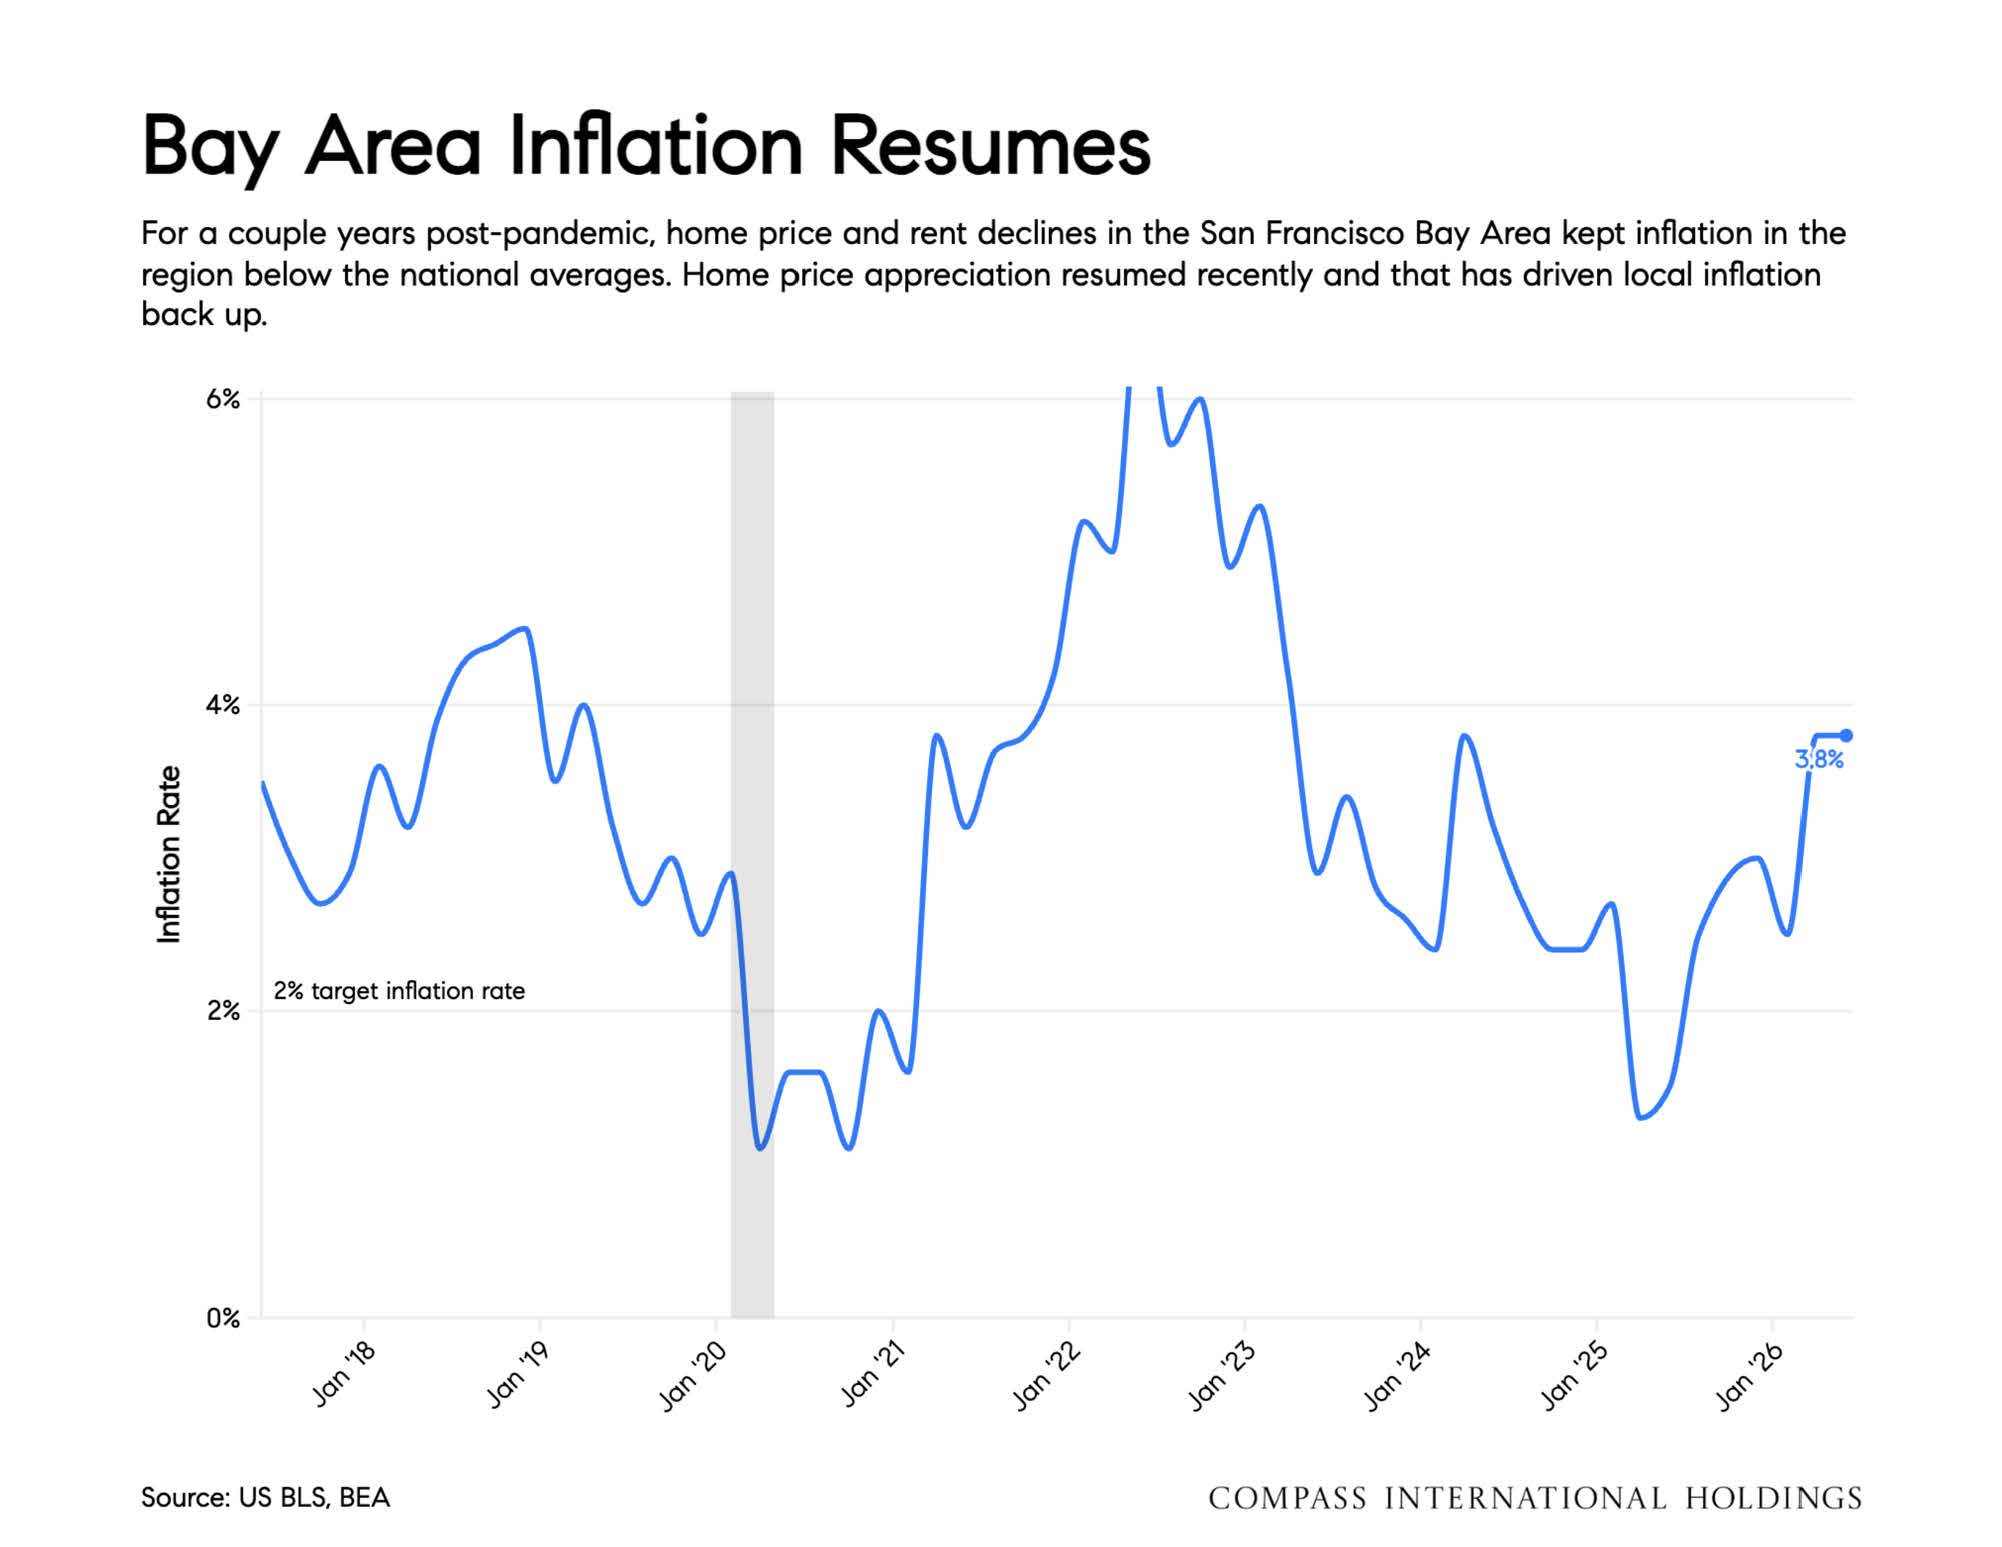
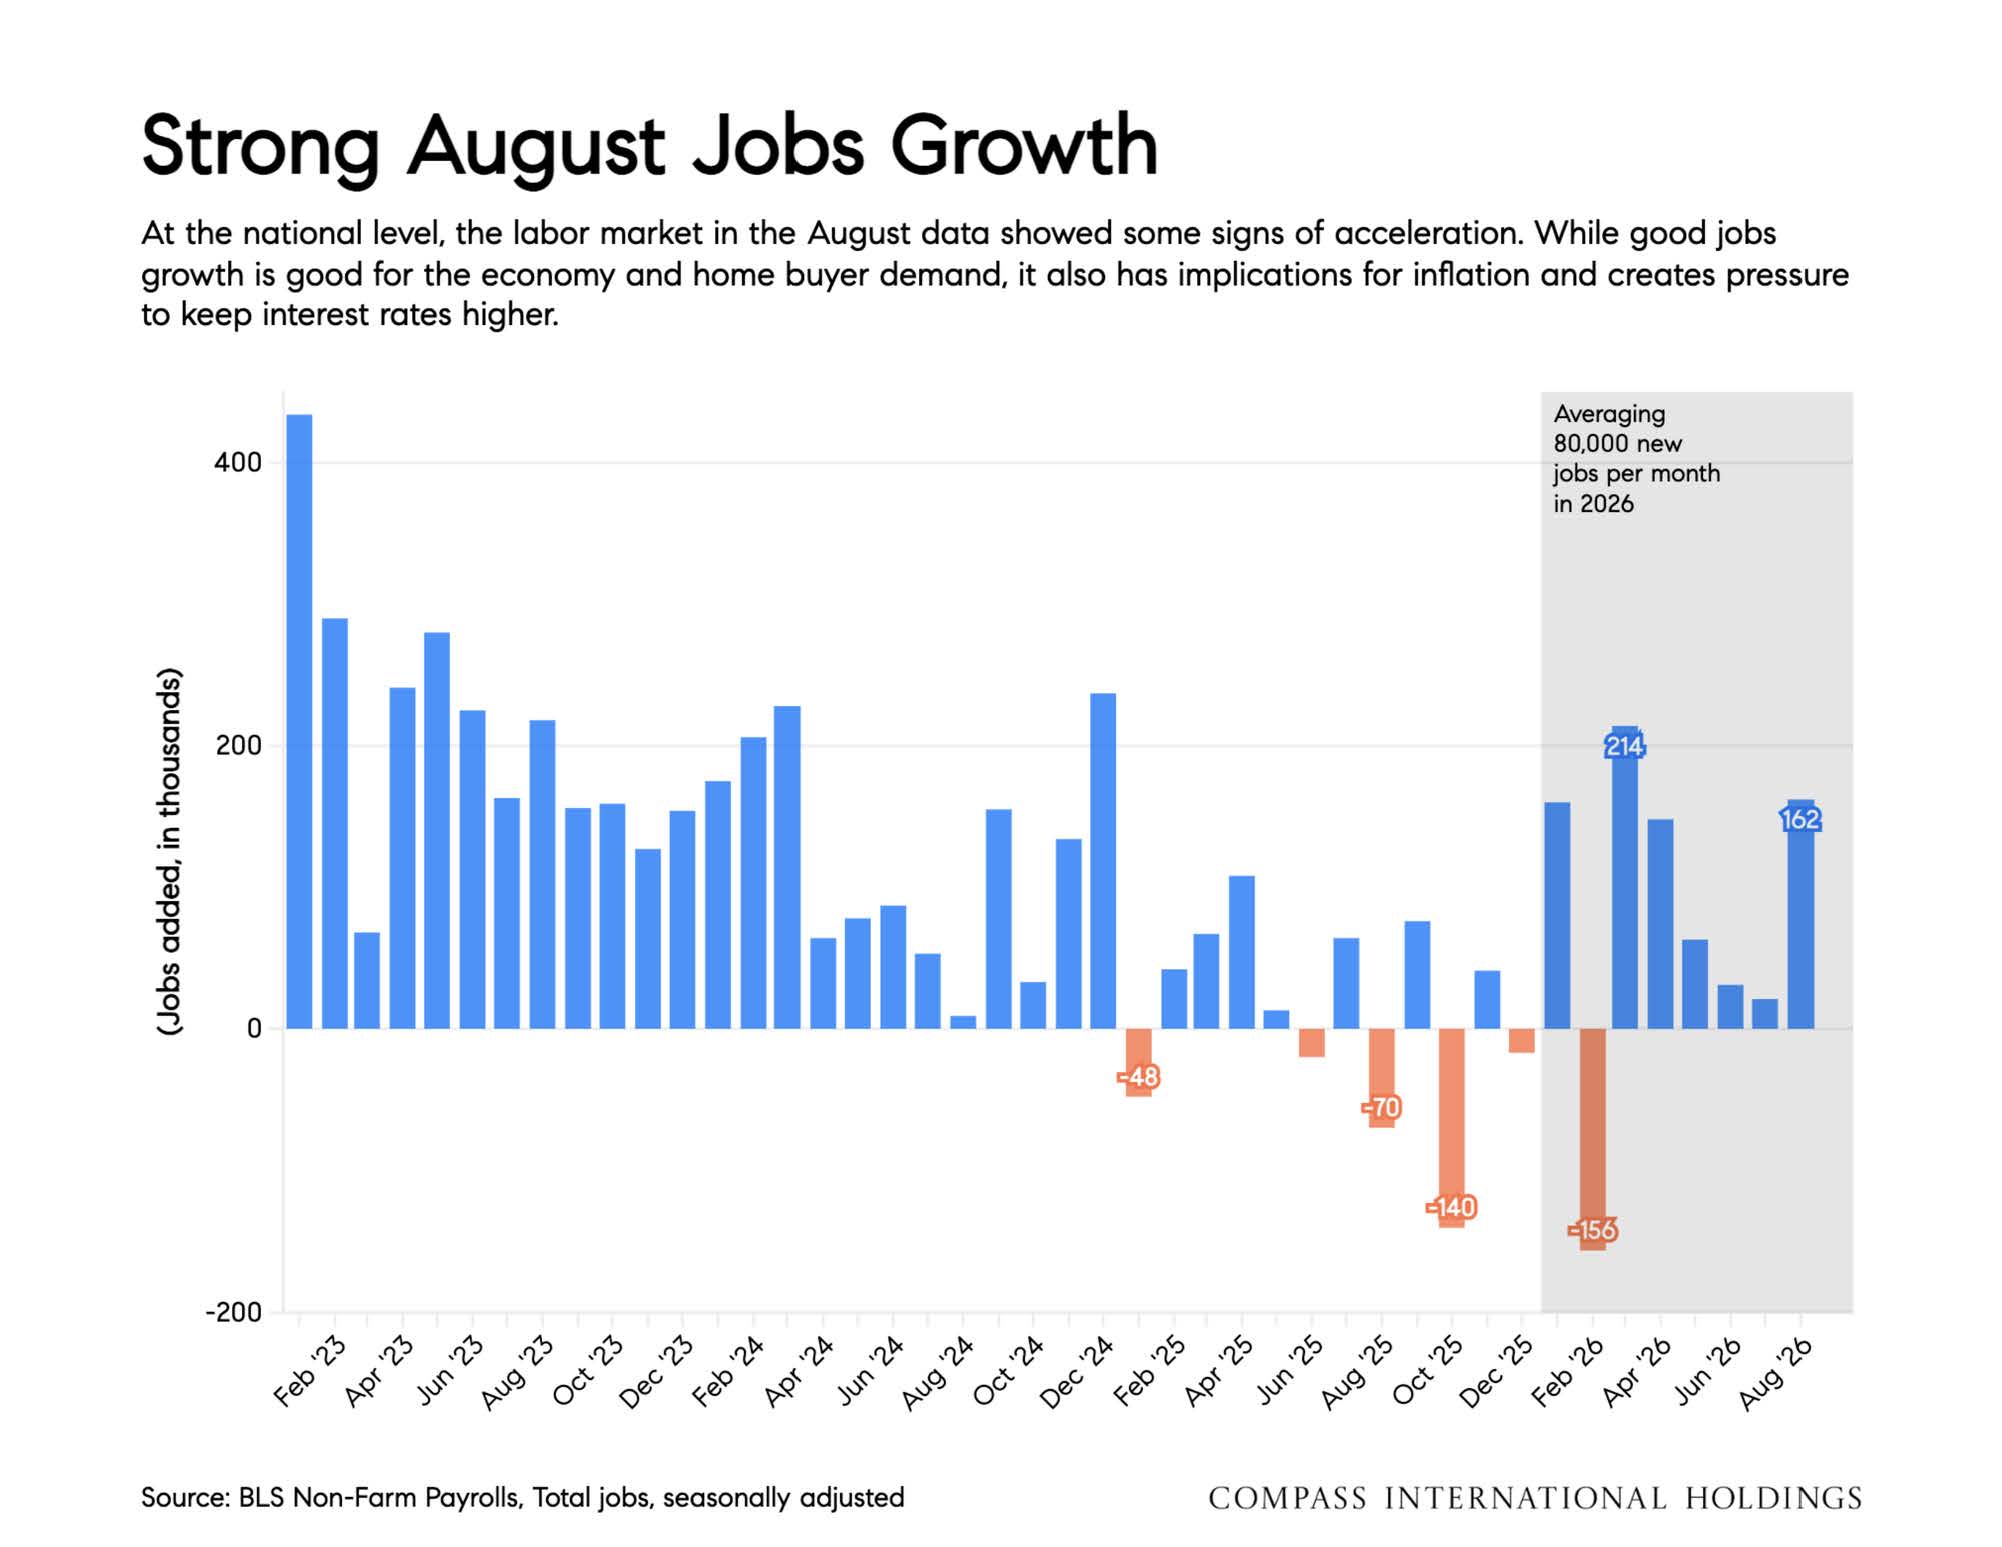
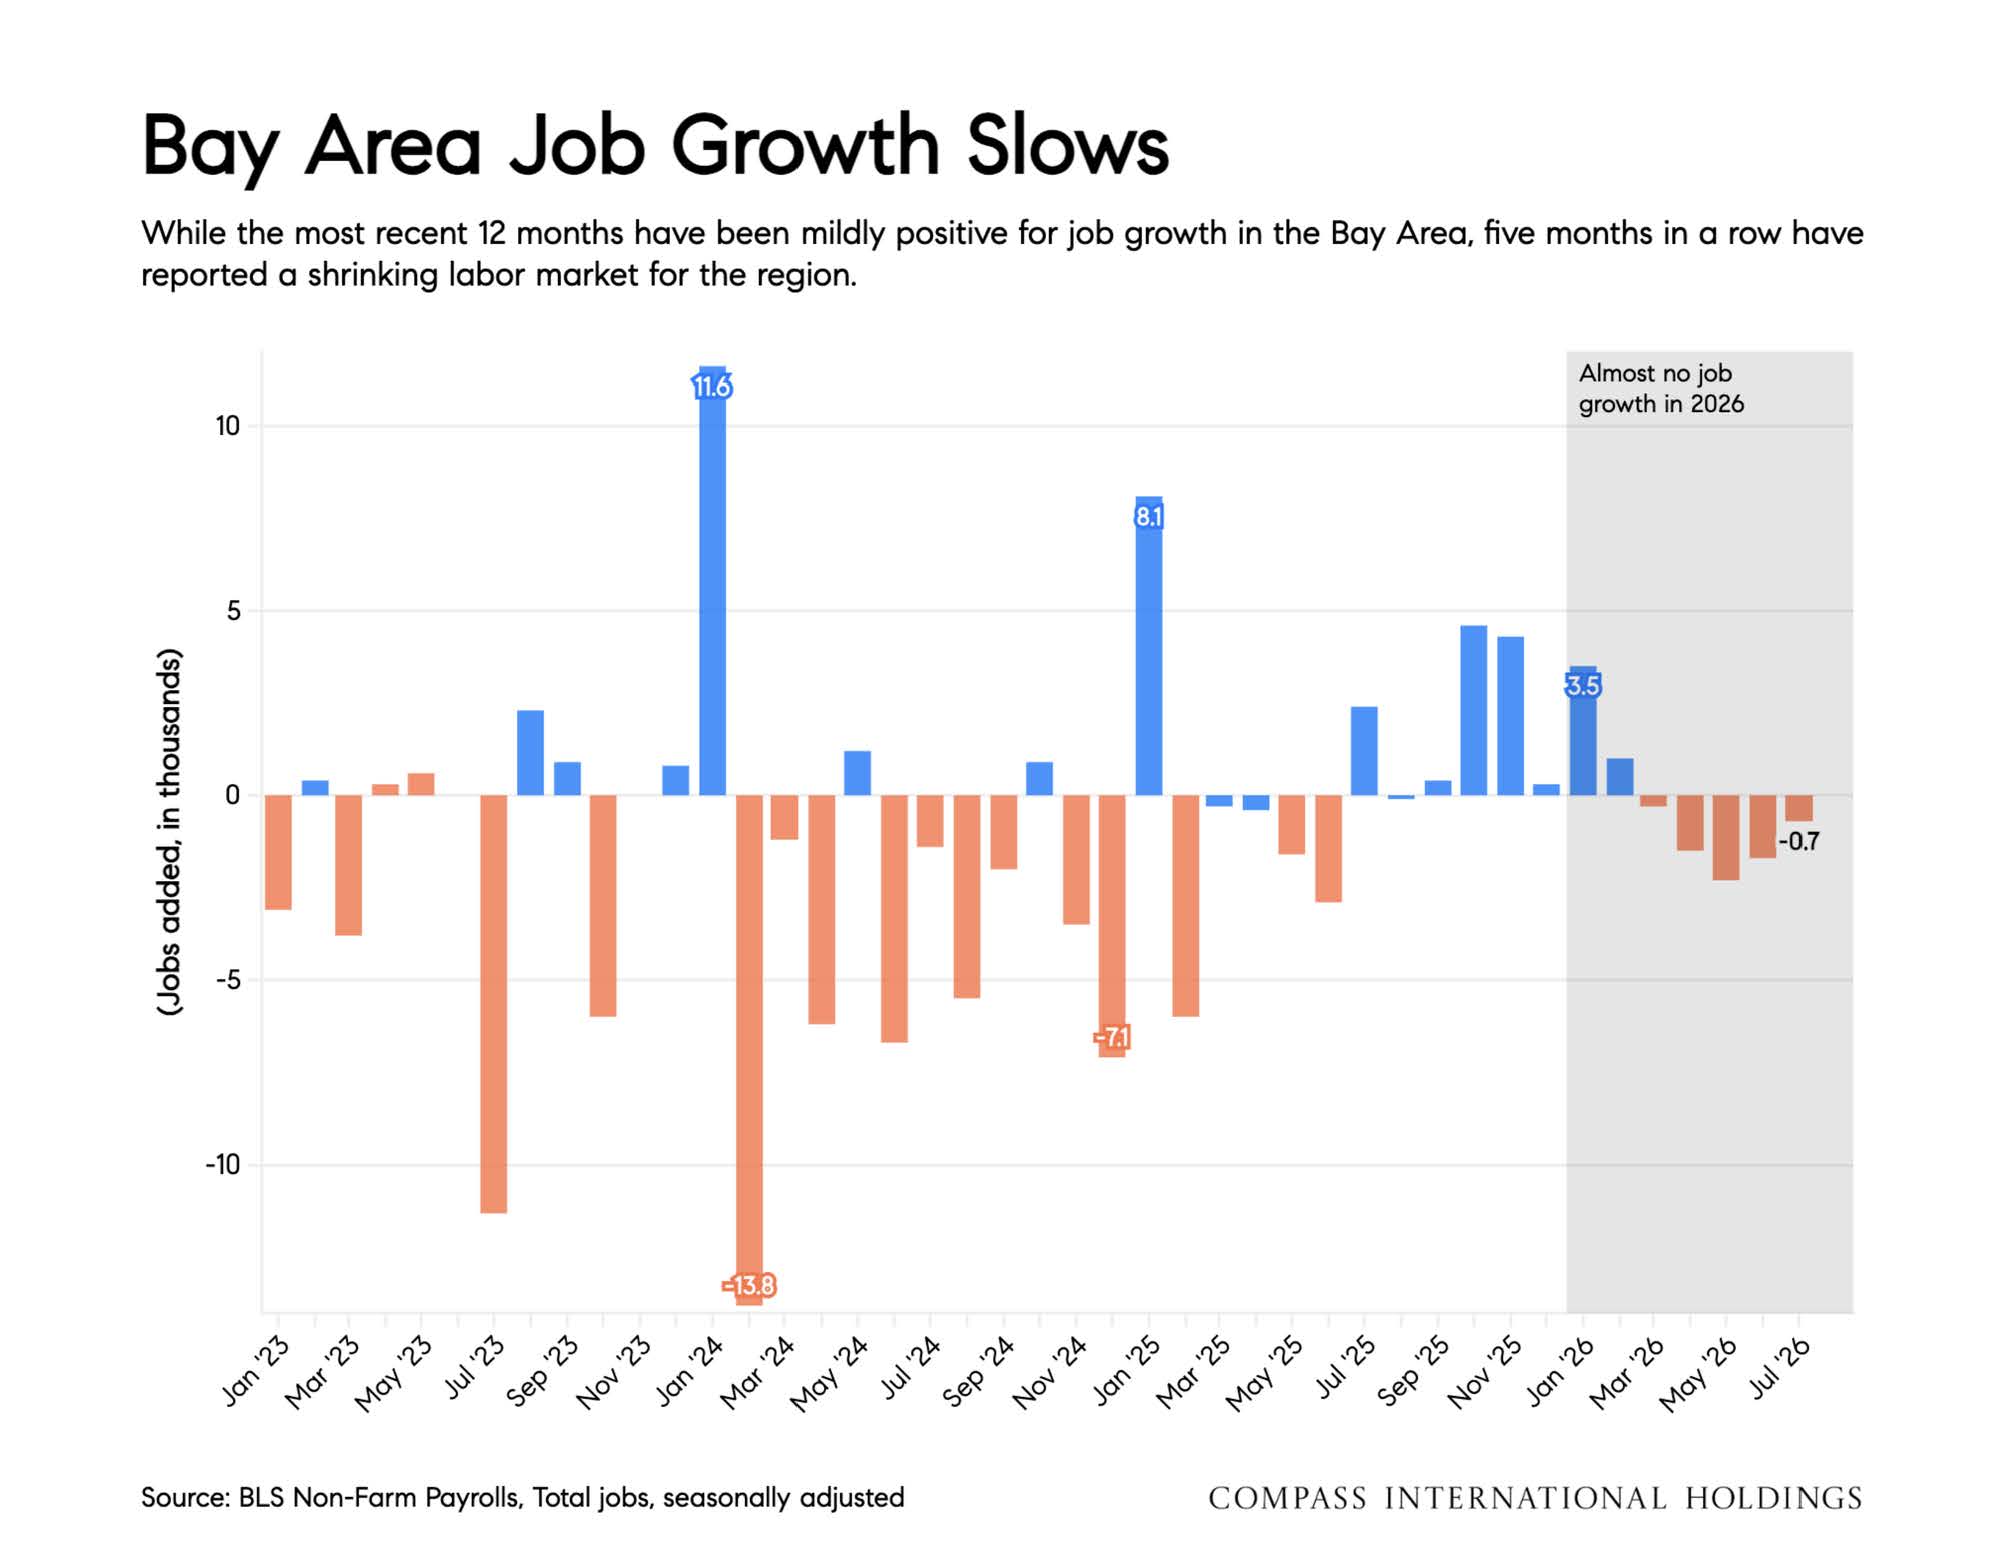
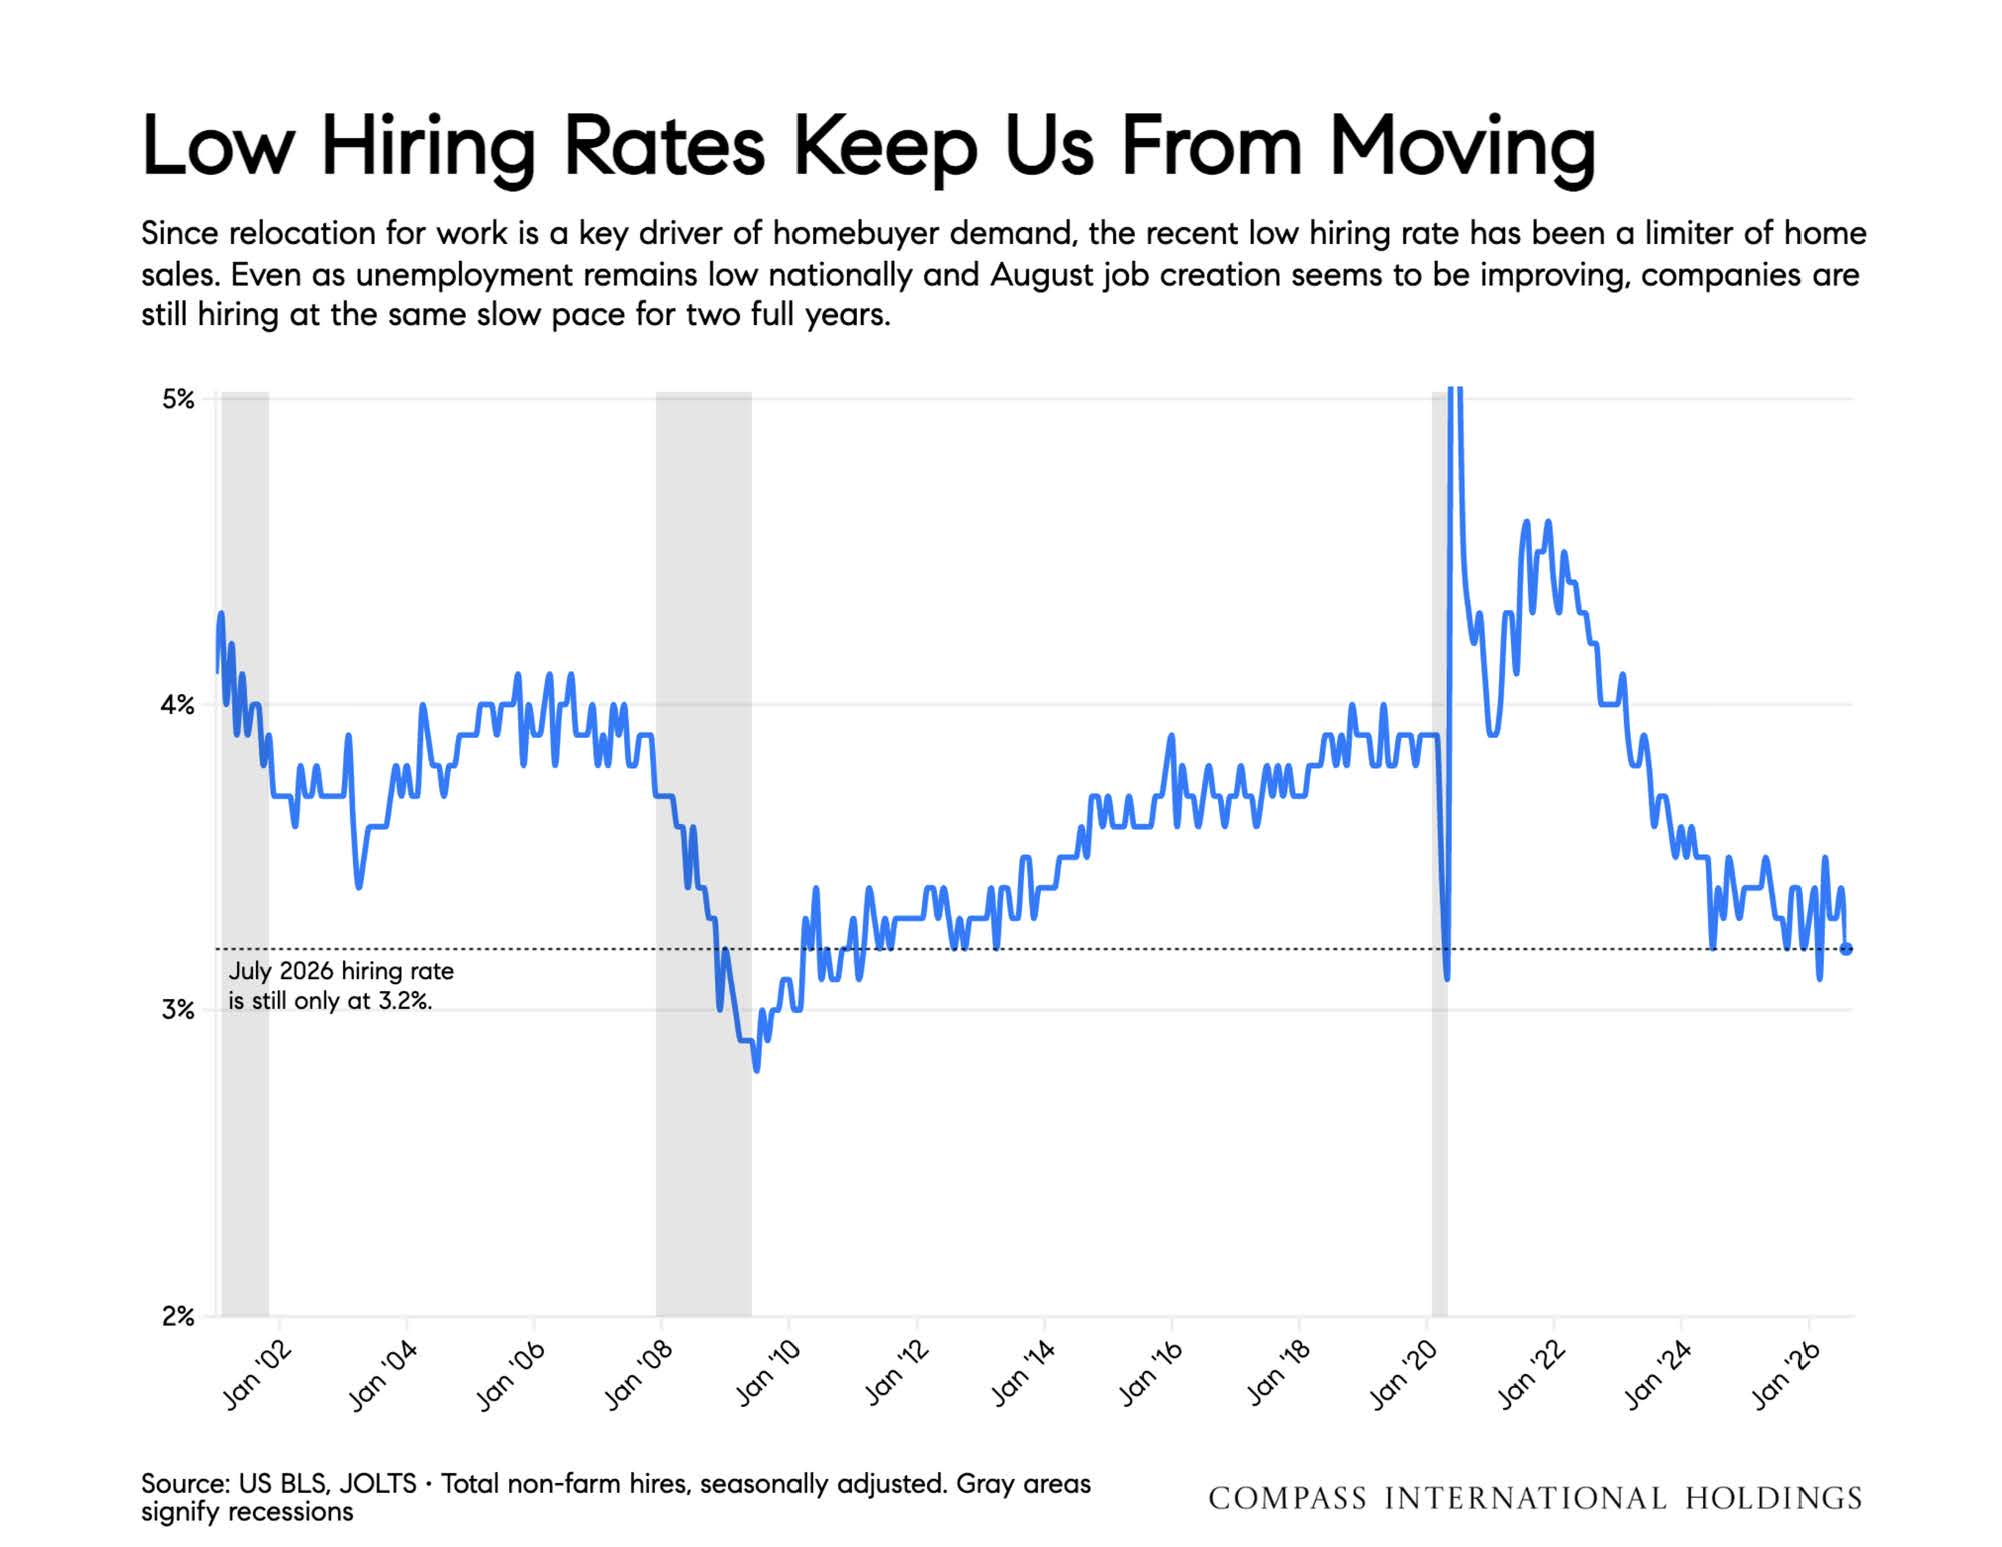
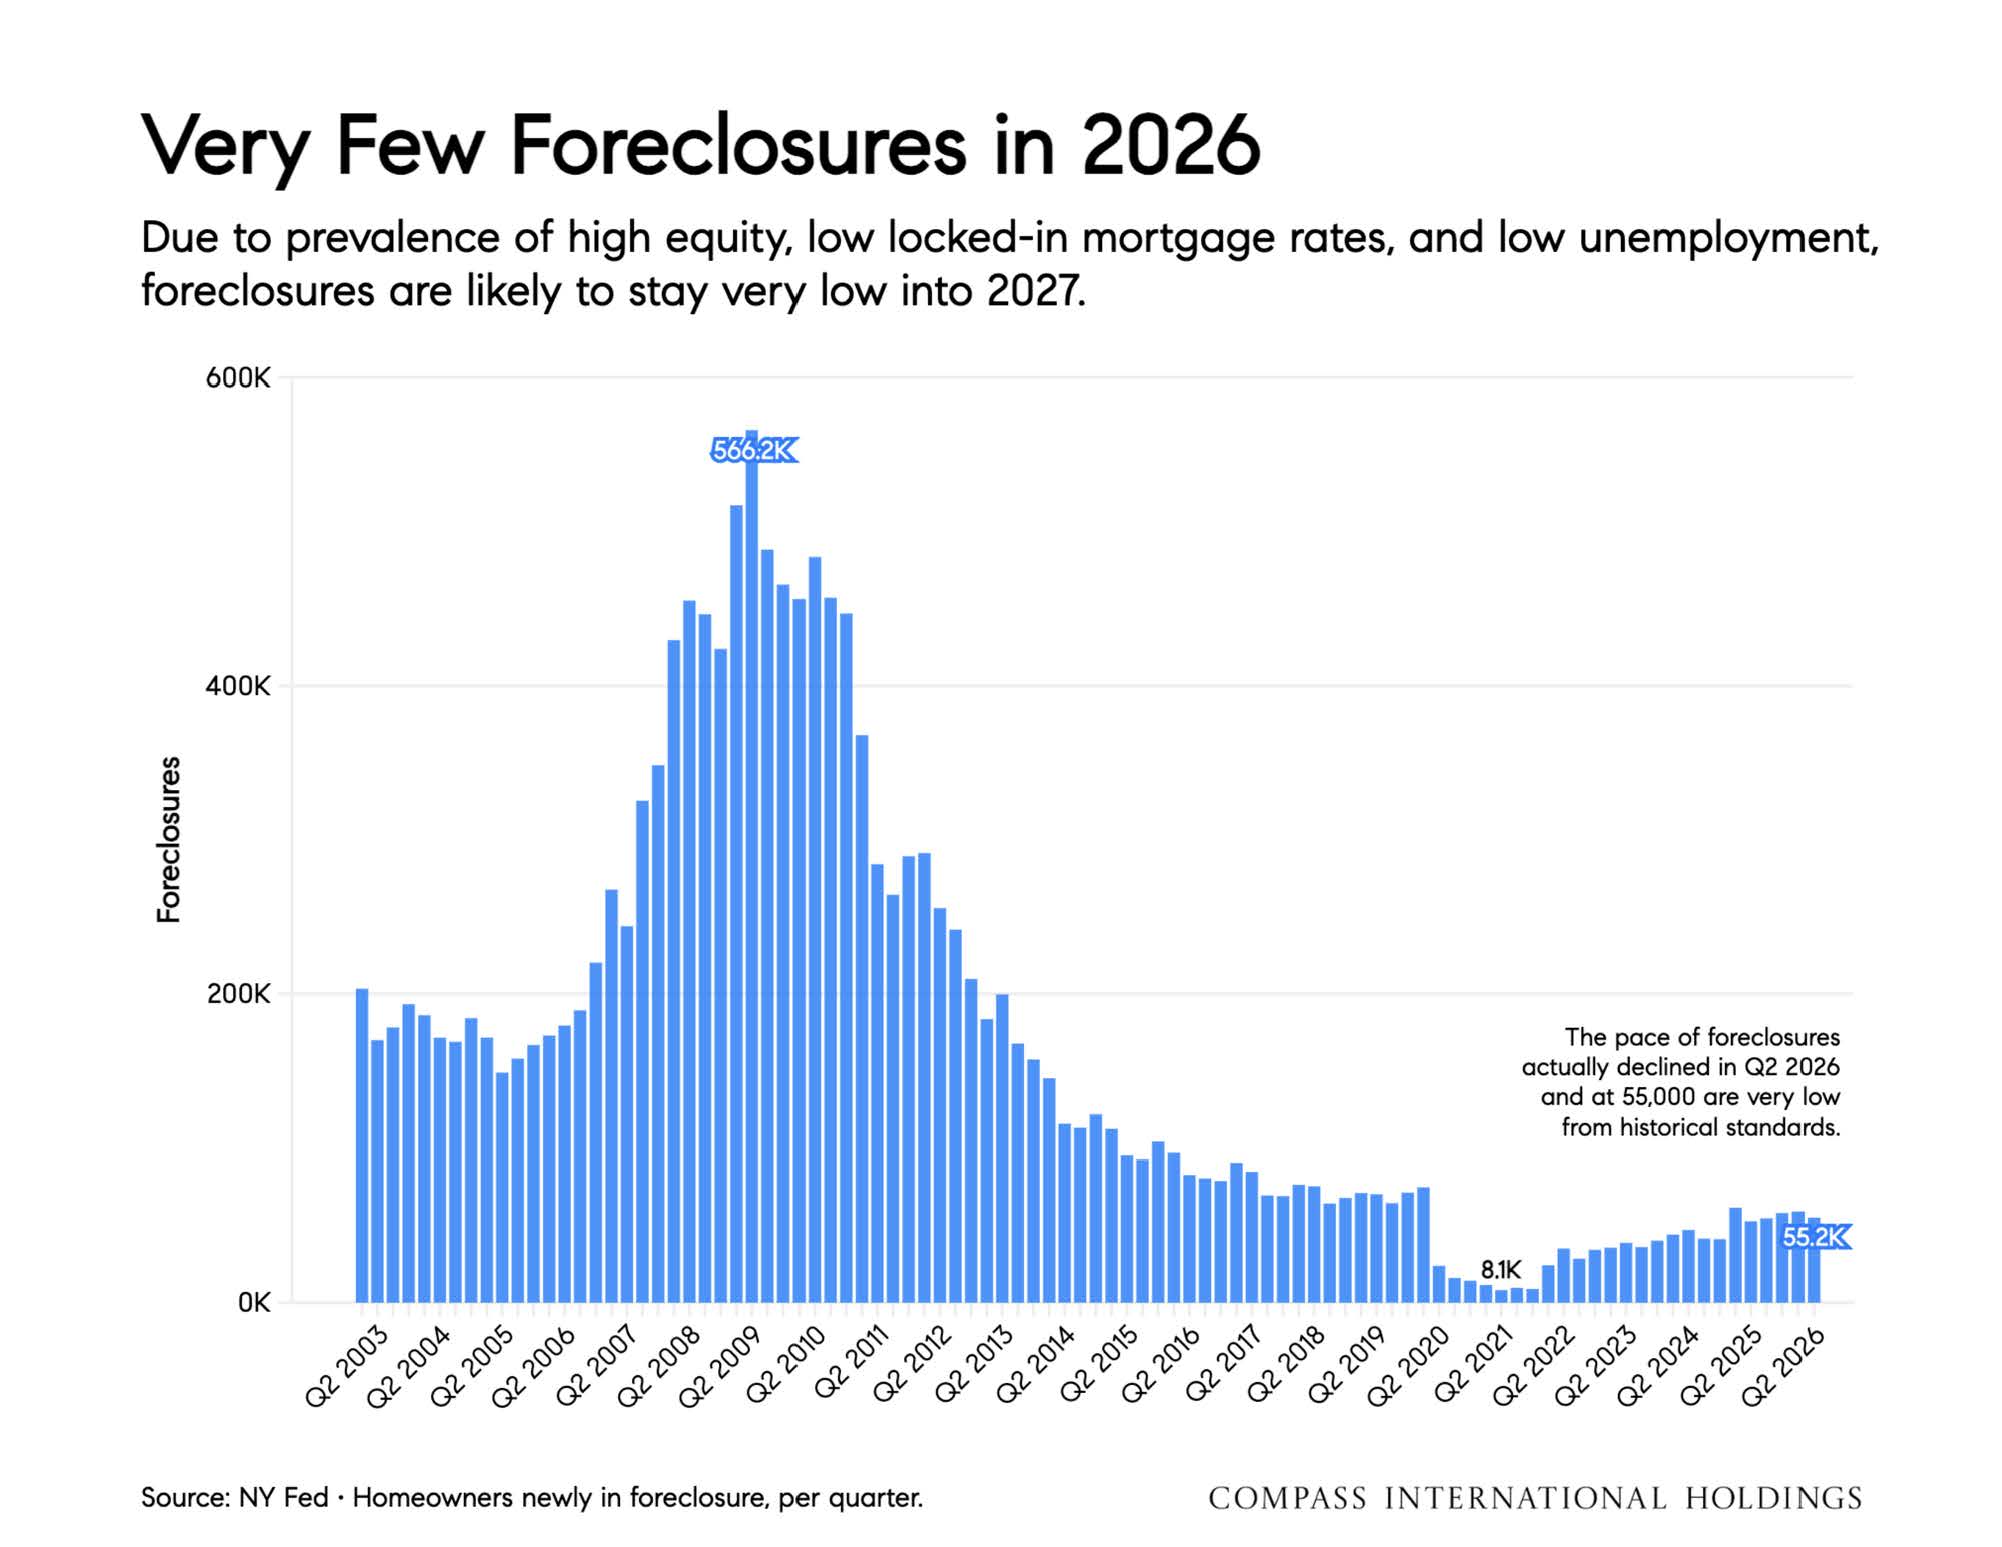
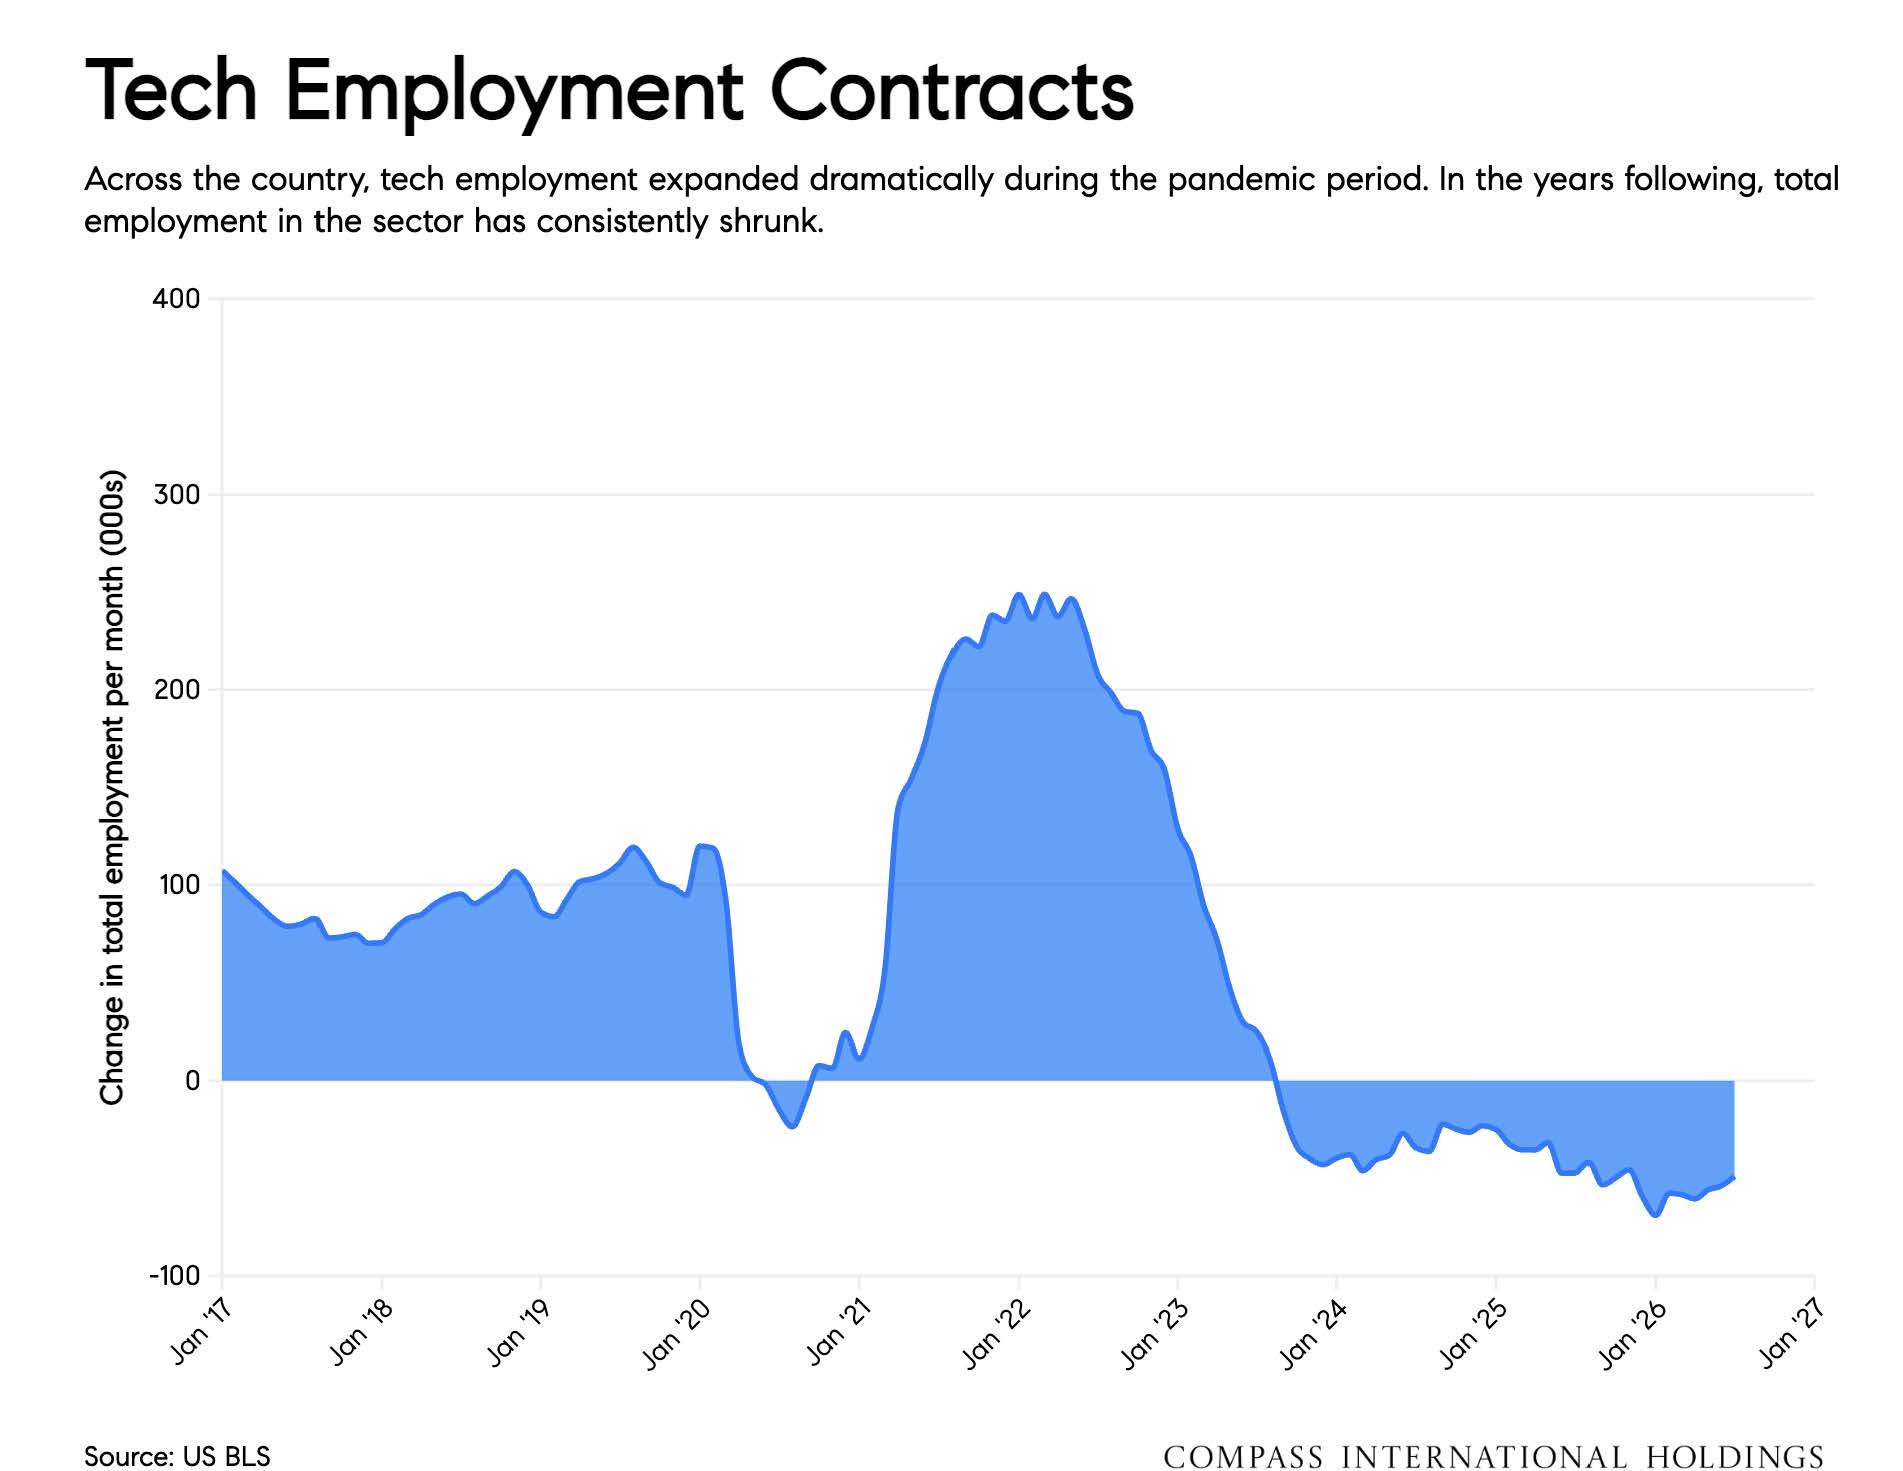
3) There are some new headwinds emerging, however, whether it be challenges in AI or rising interest rates.
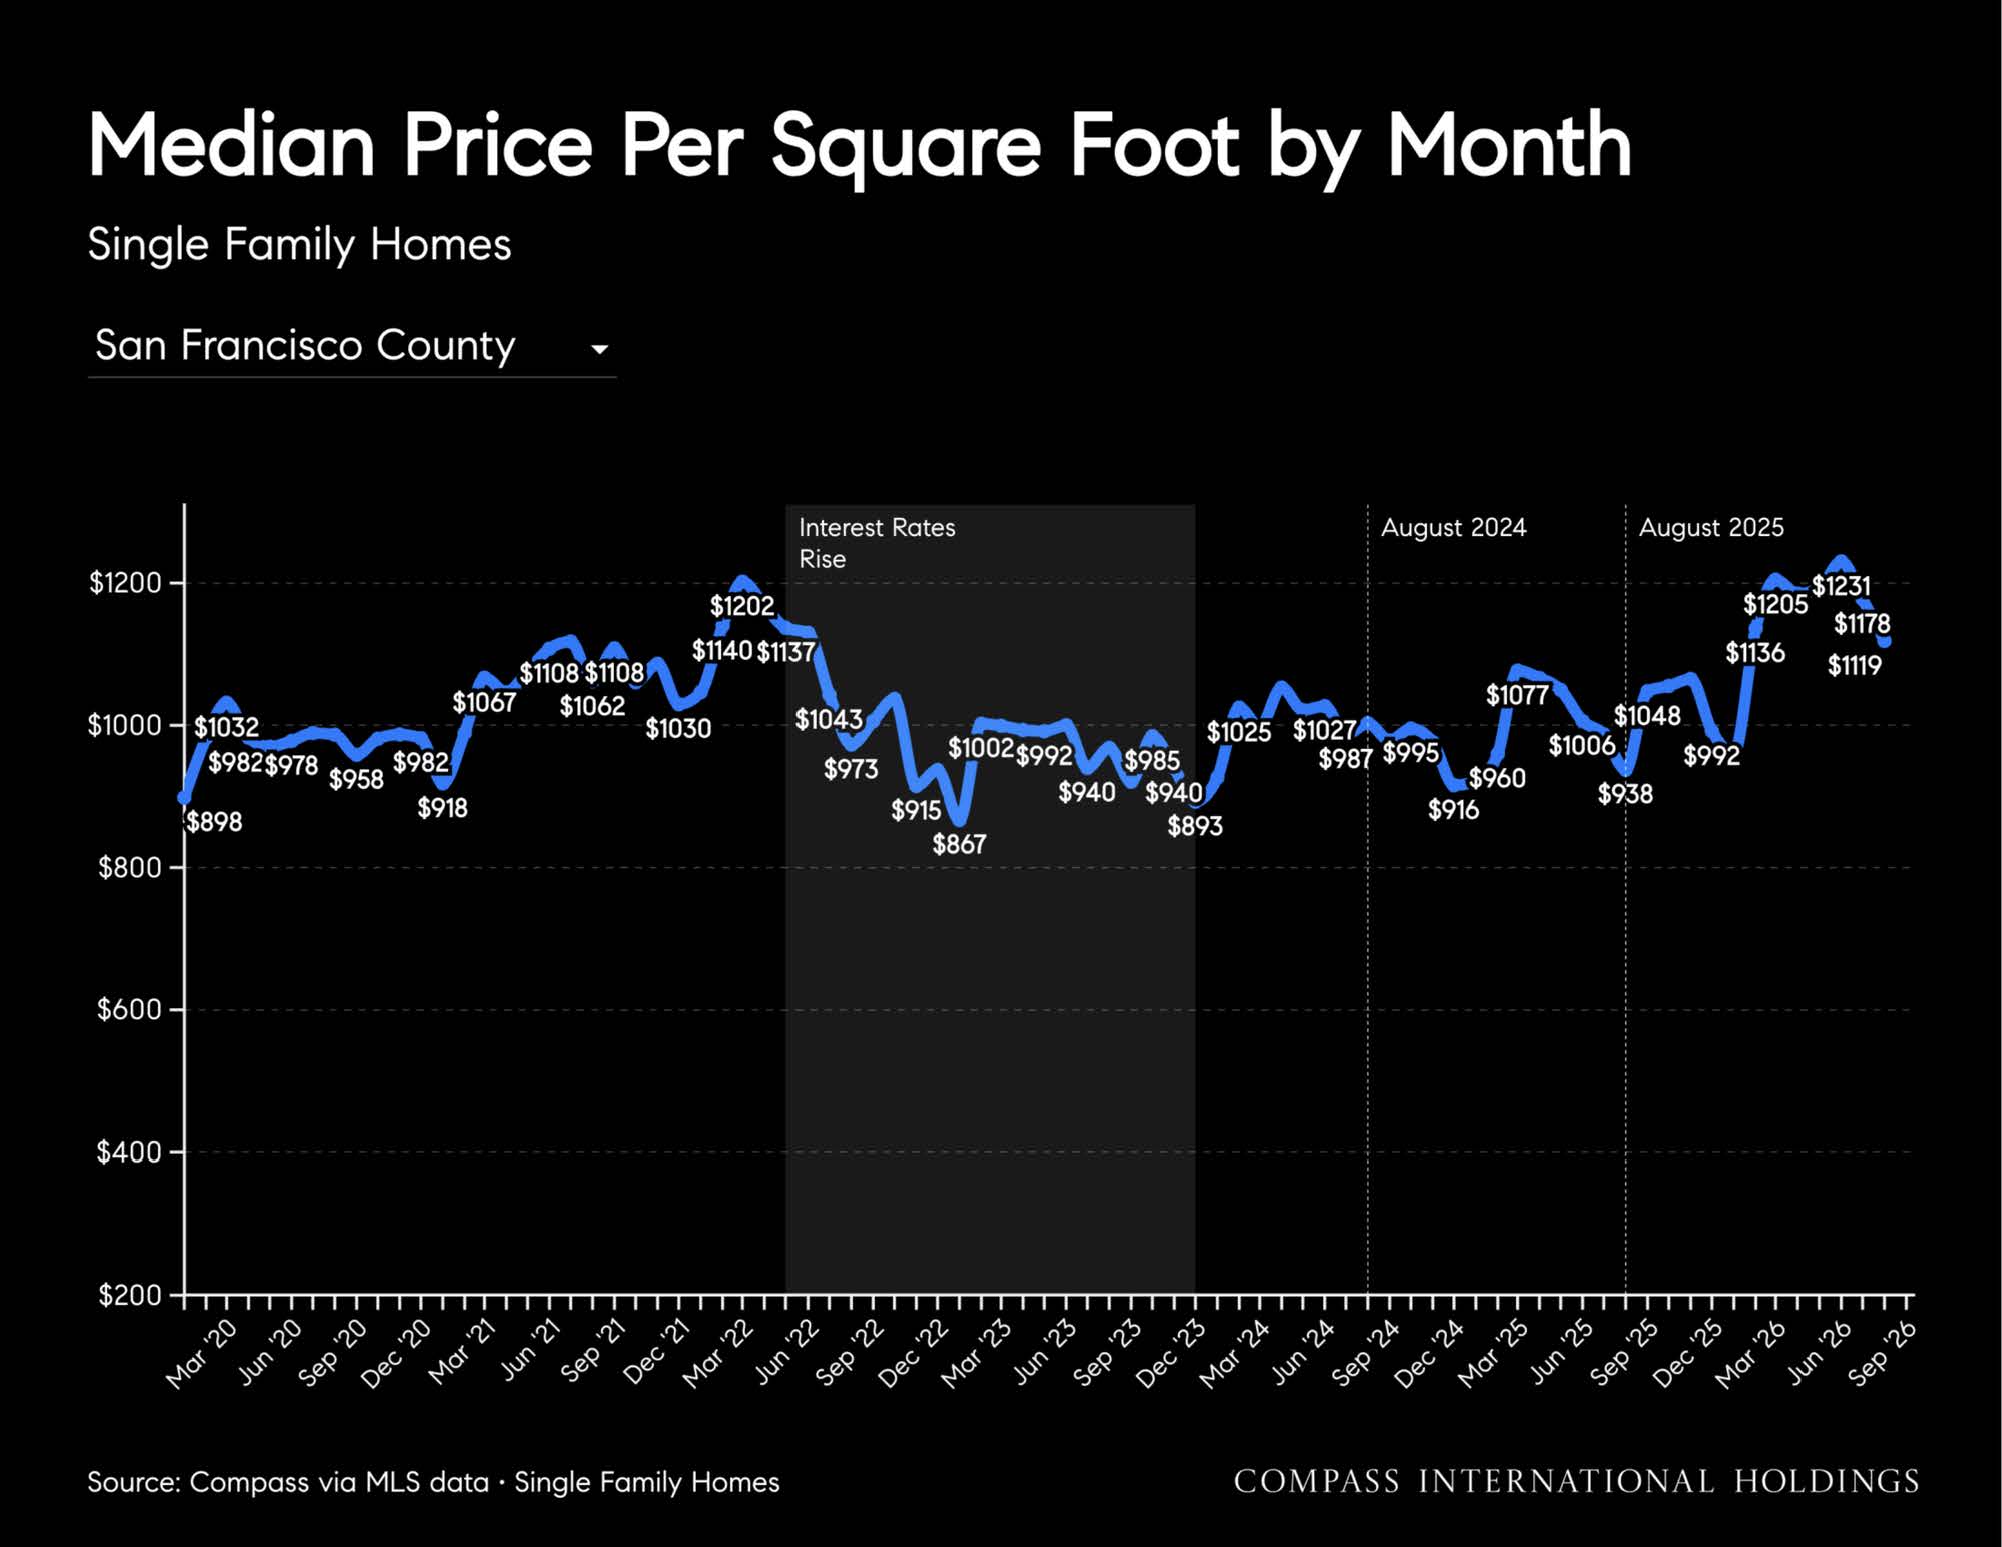
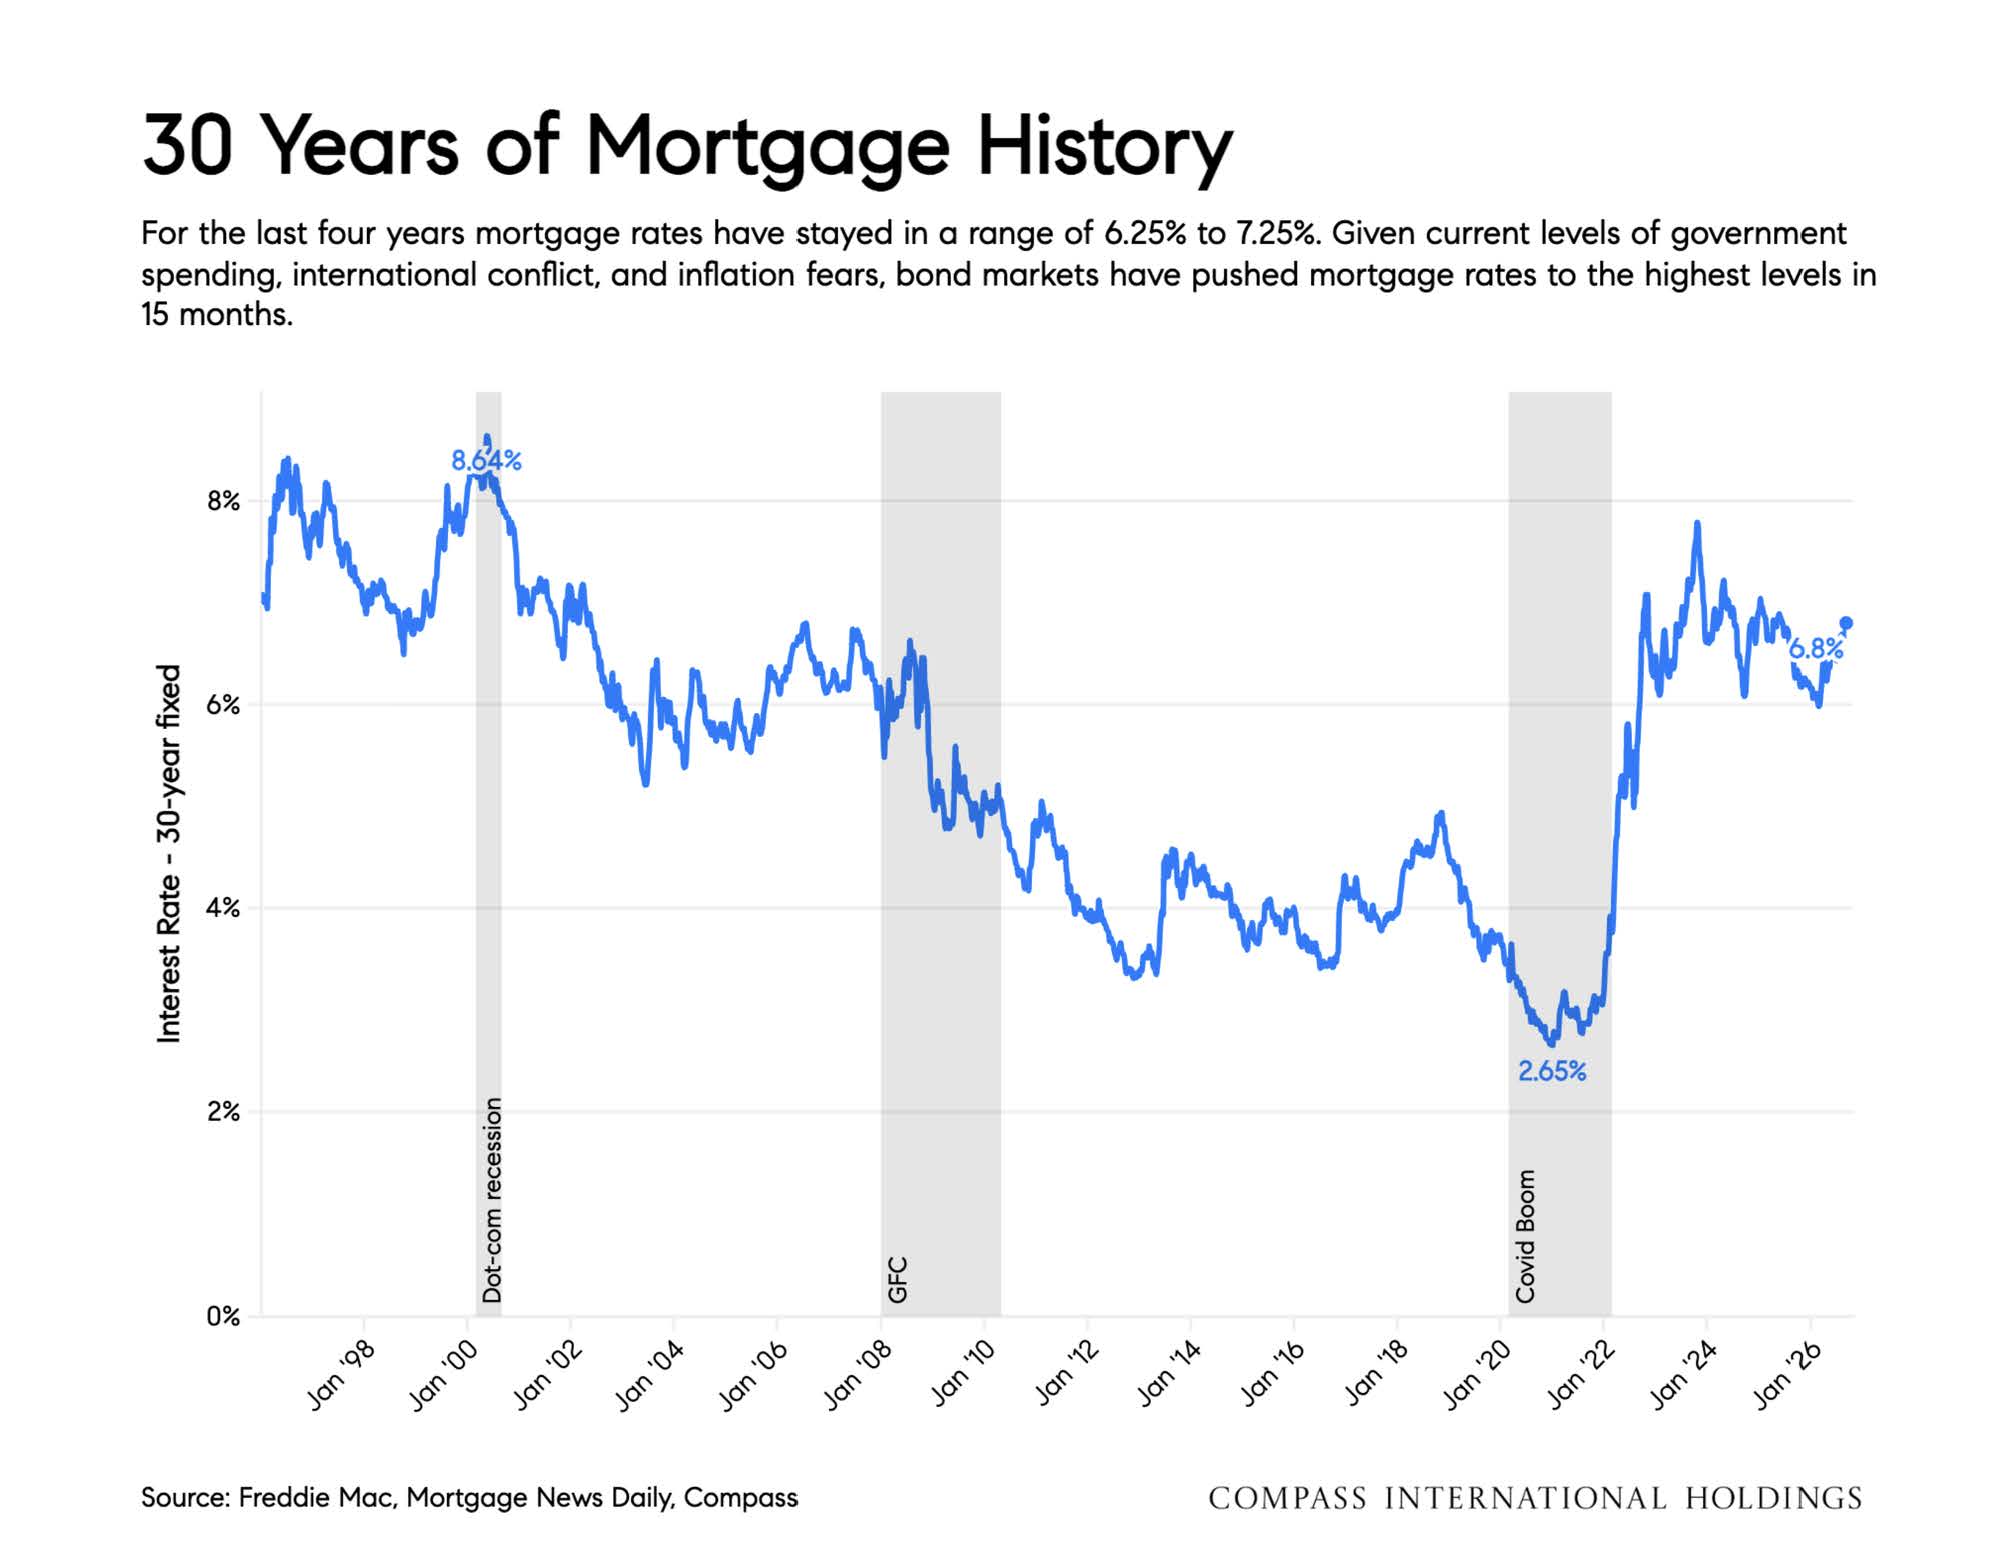
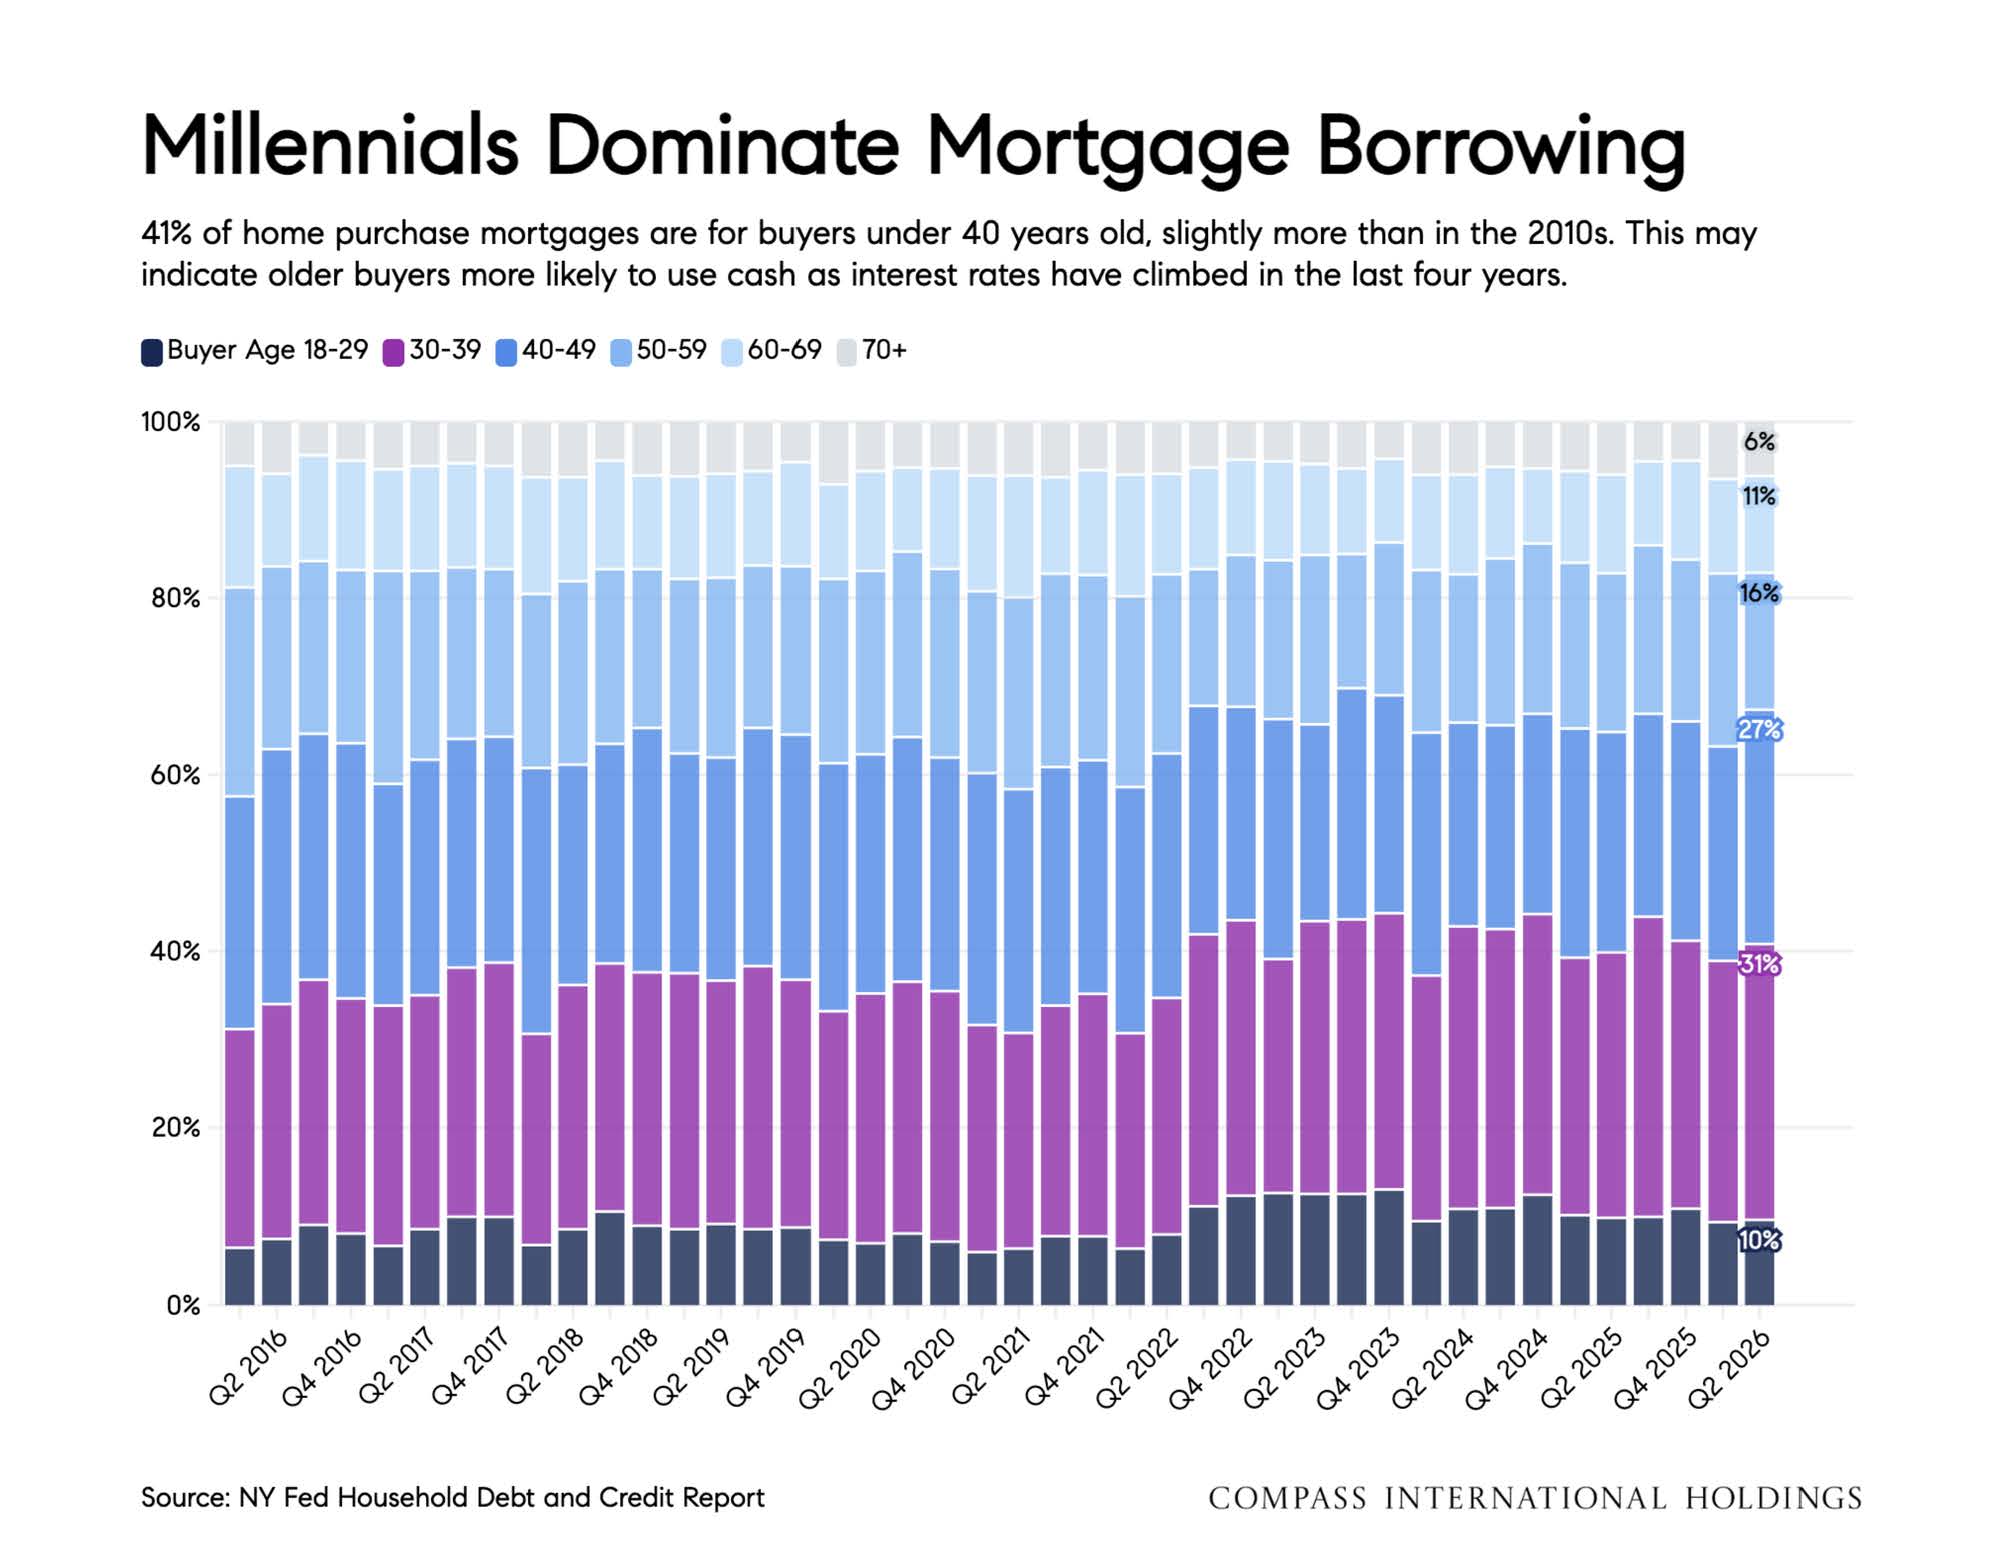
Interest rates have risen to their highest level in 14+ months, with the 30-yr fixed hovering right around 7%. The fed unanimously raised rates 0.25% 1 week ago today, and has projected additional rate hikes in 2026.
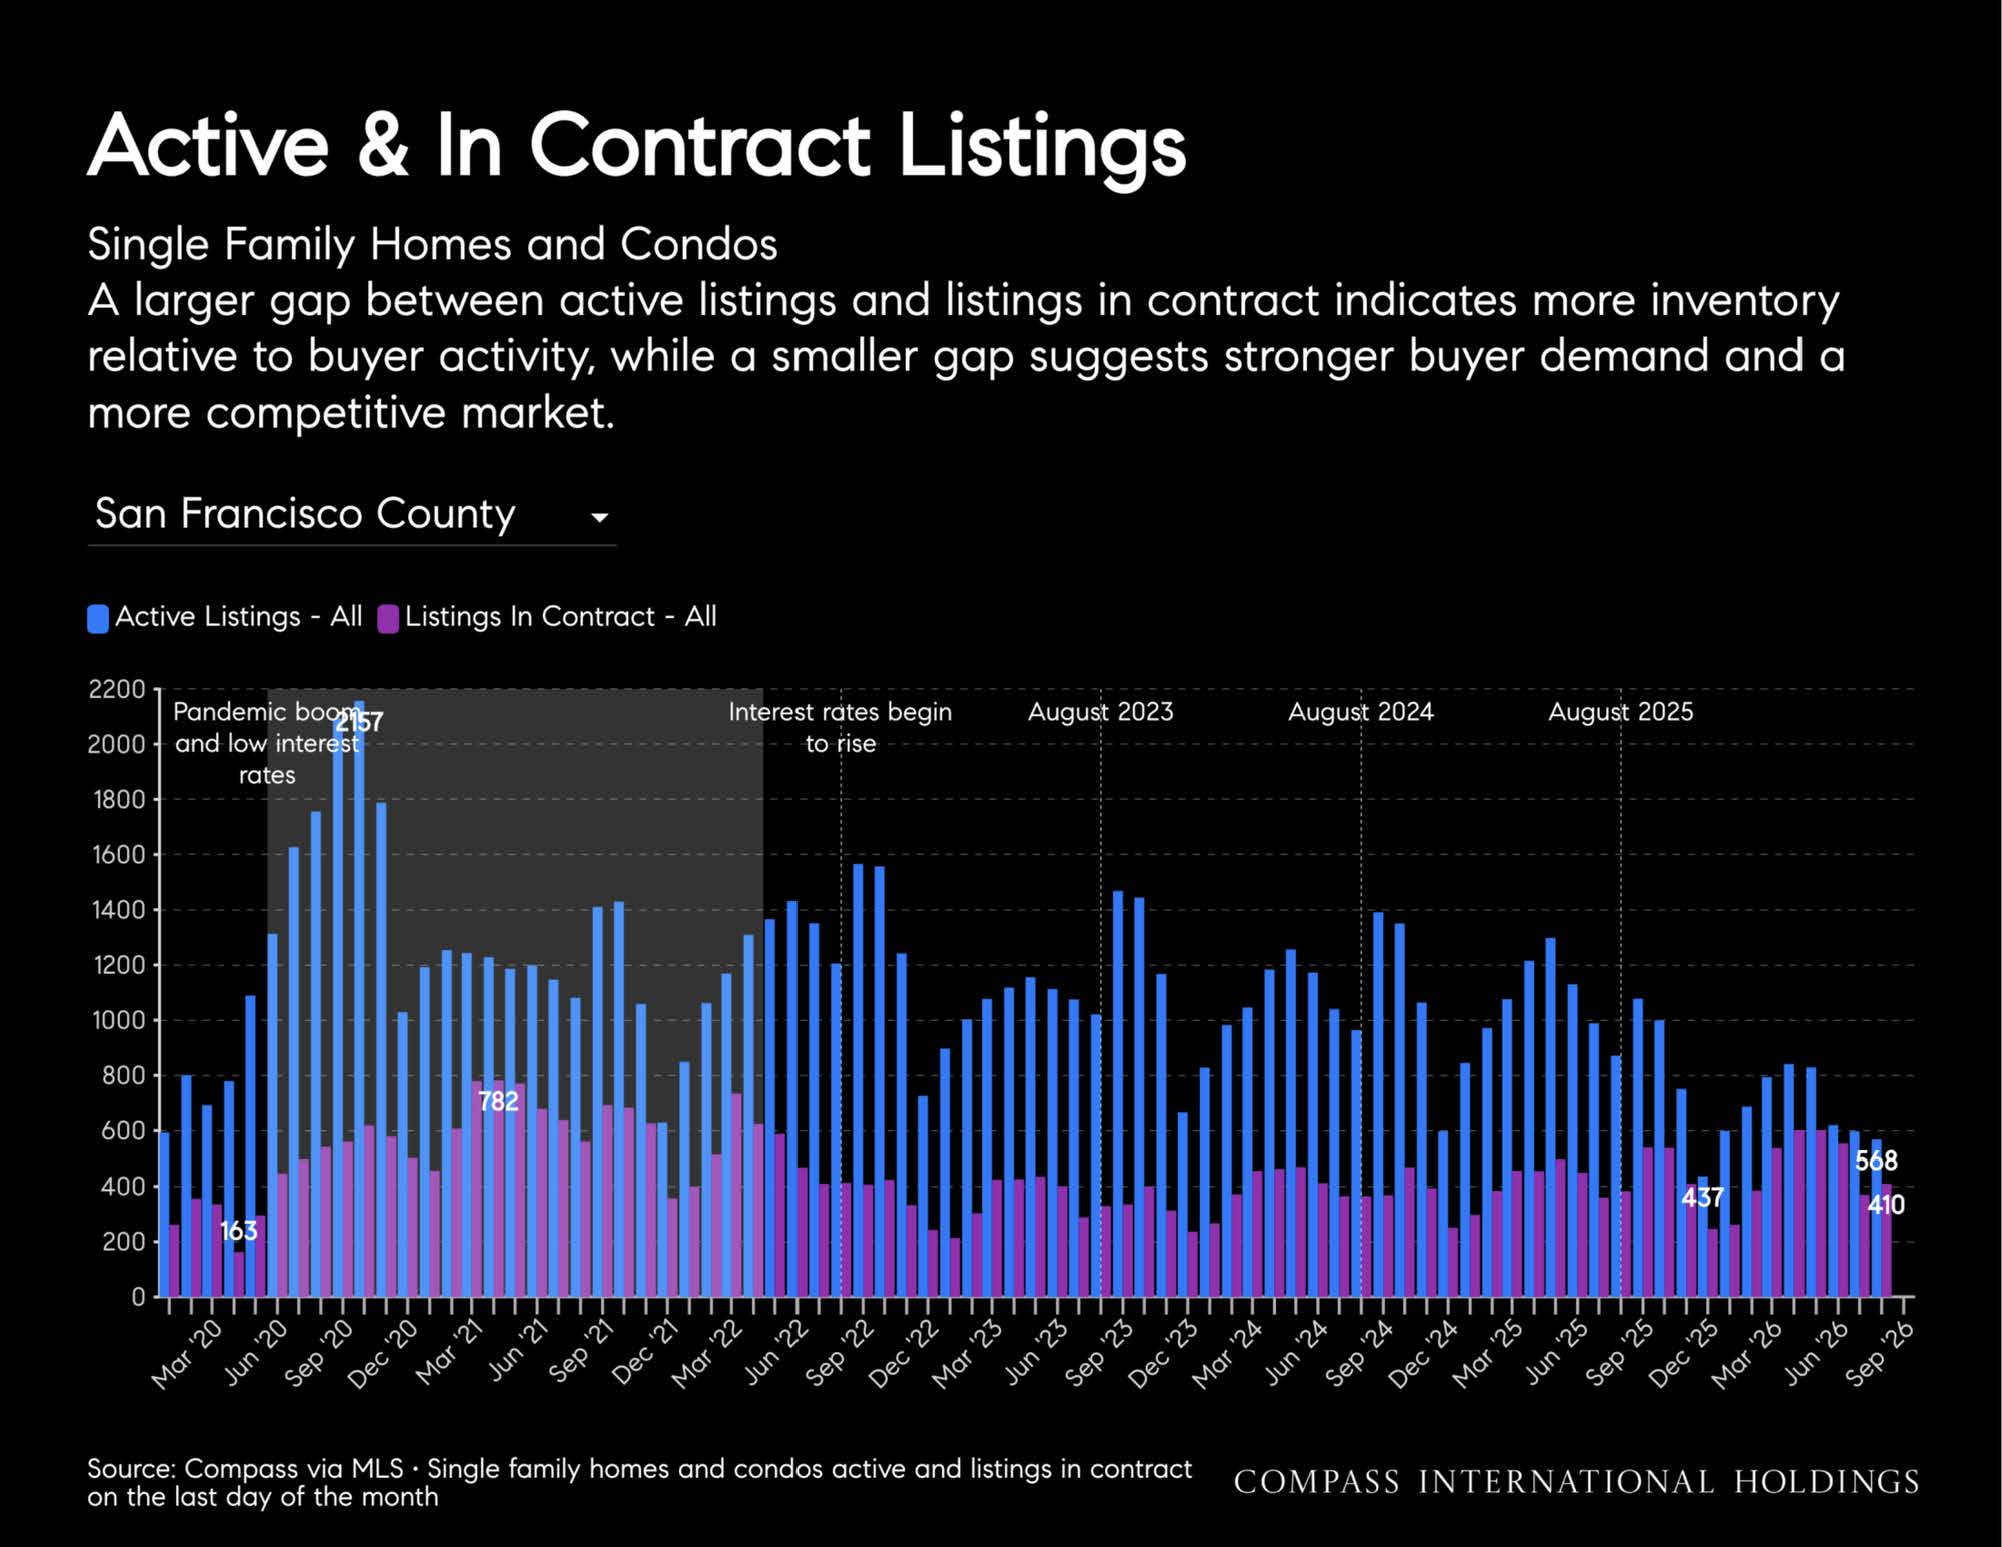
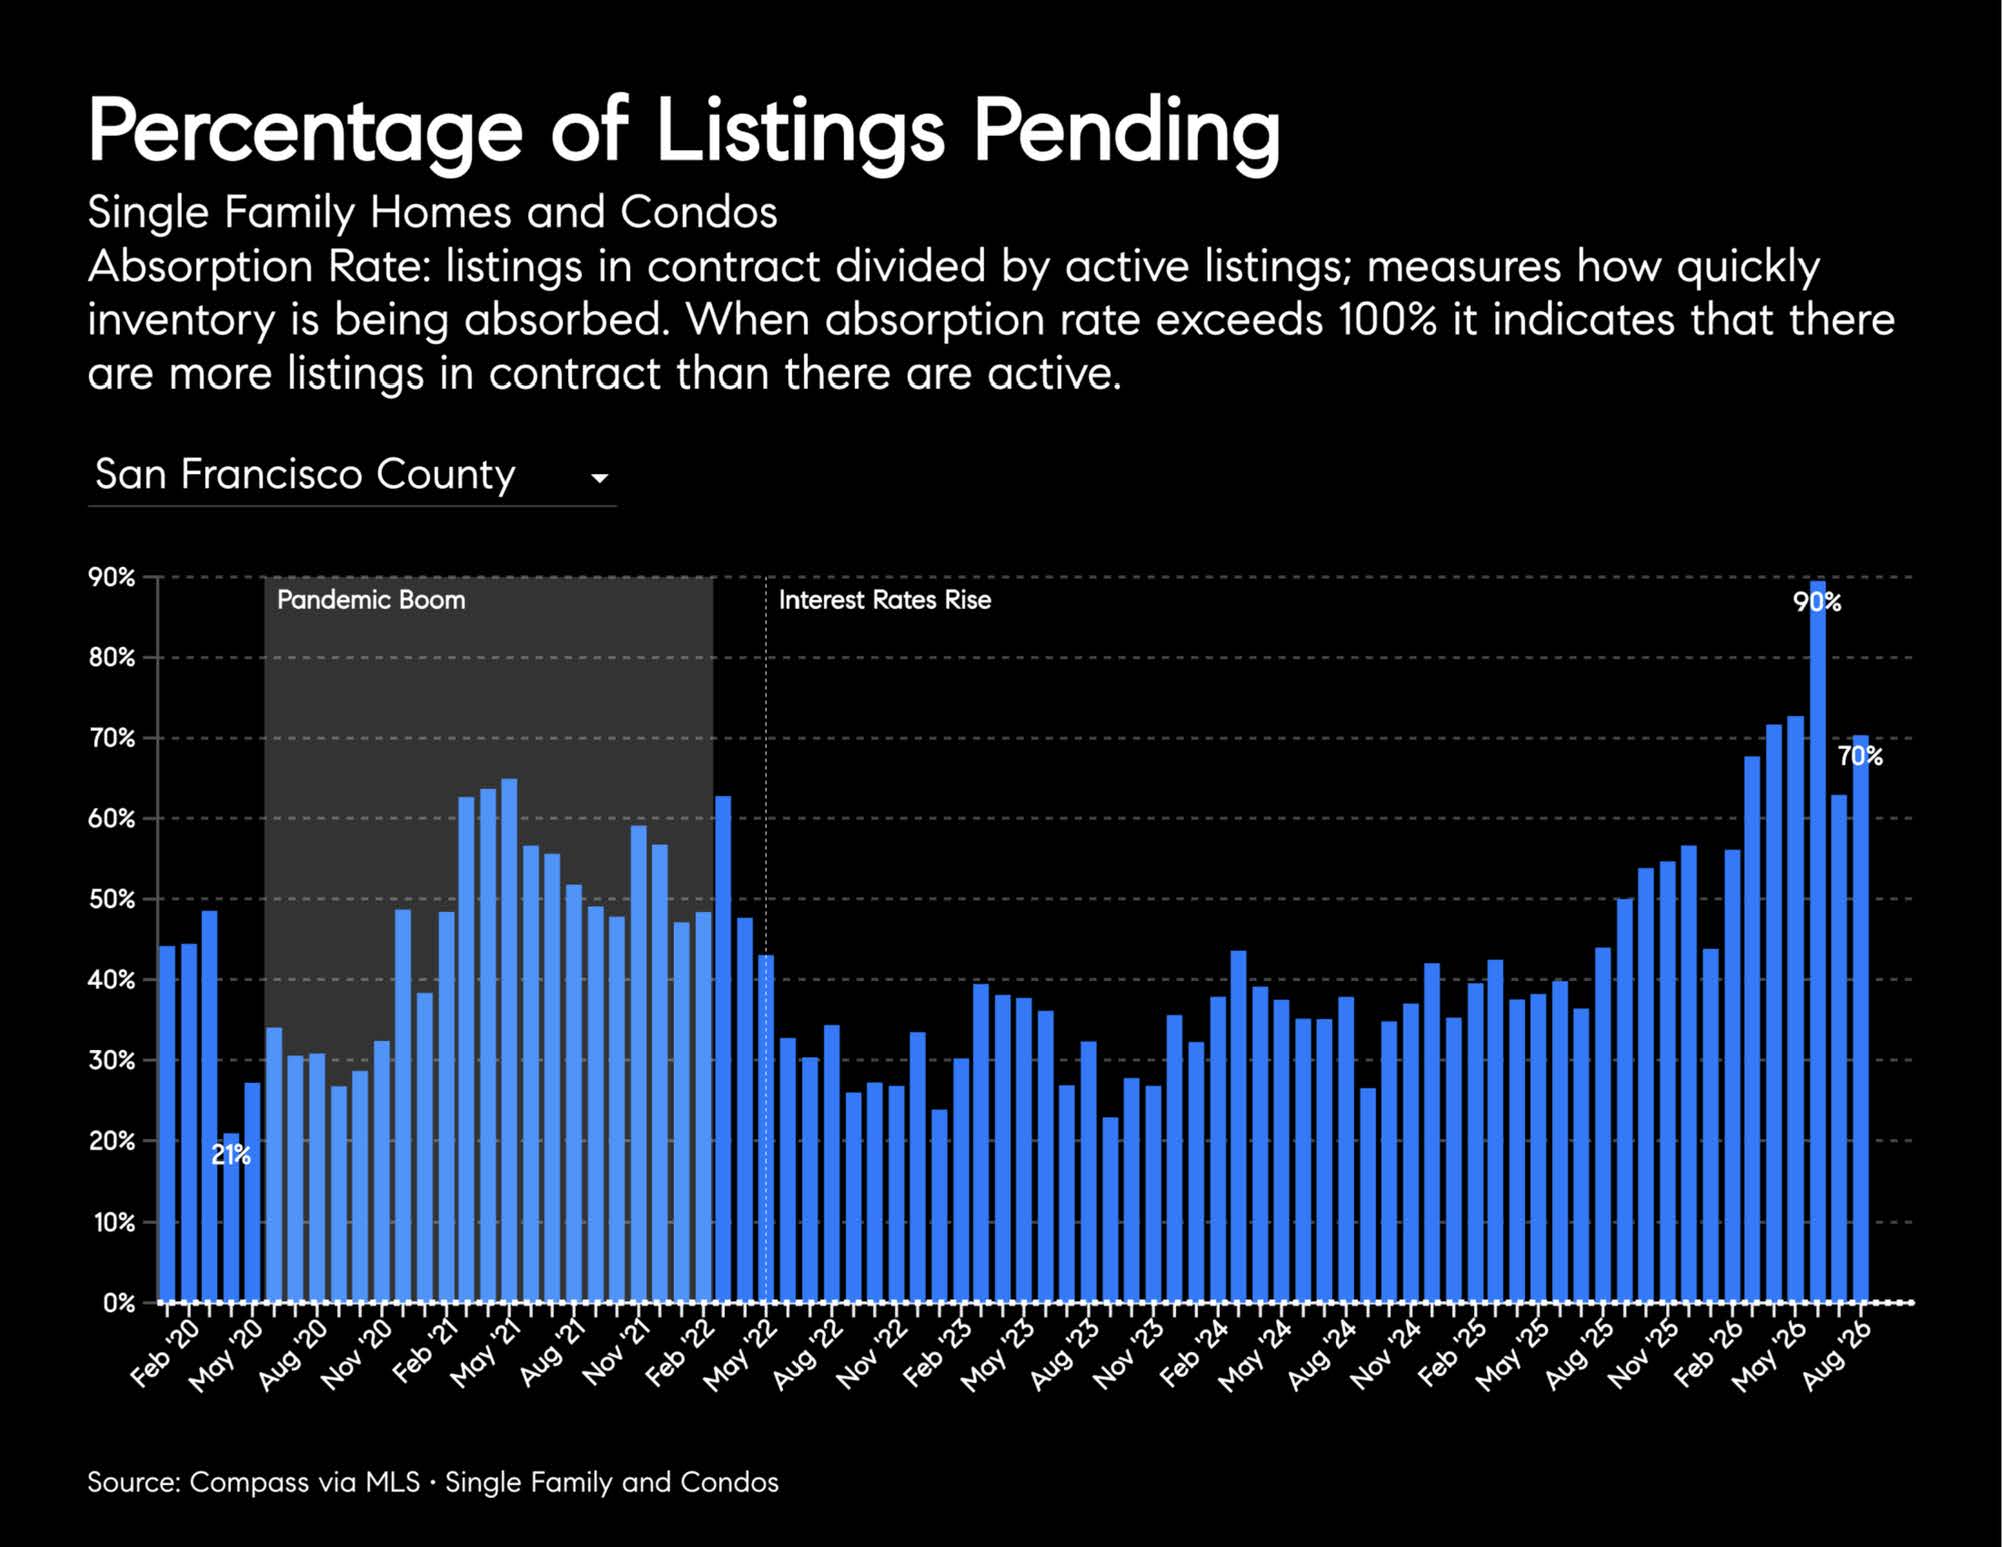
While this is harsh news for most housing markets across the country, the supply/demand ratios are still very much in favor of sellers in San Francisco.
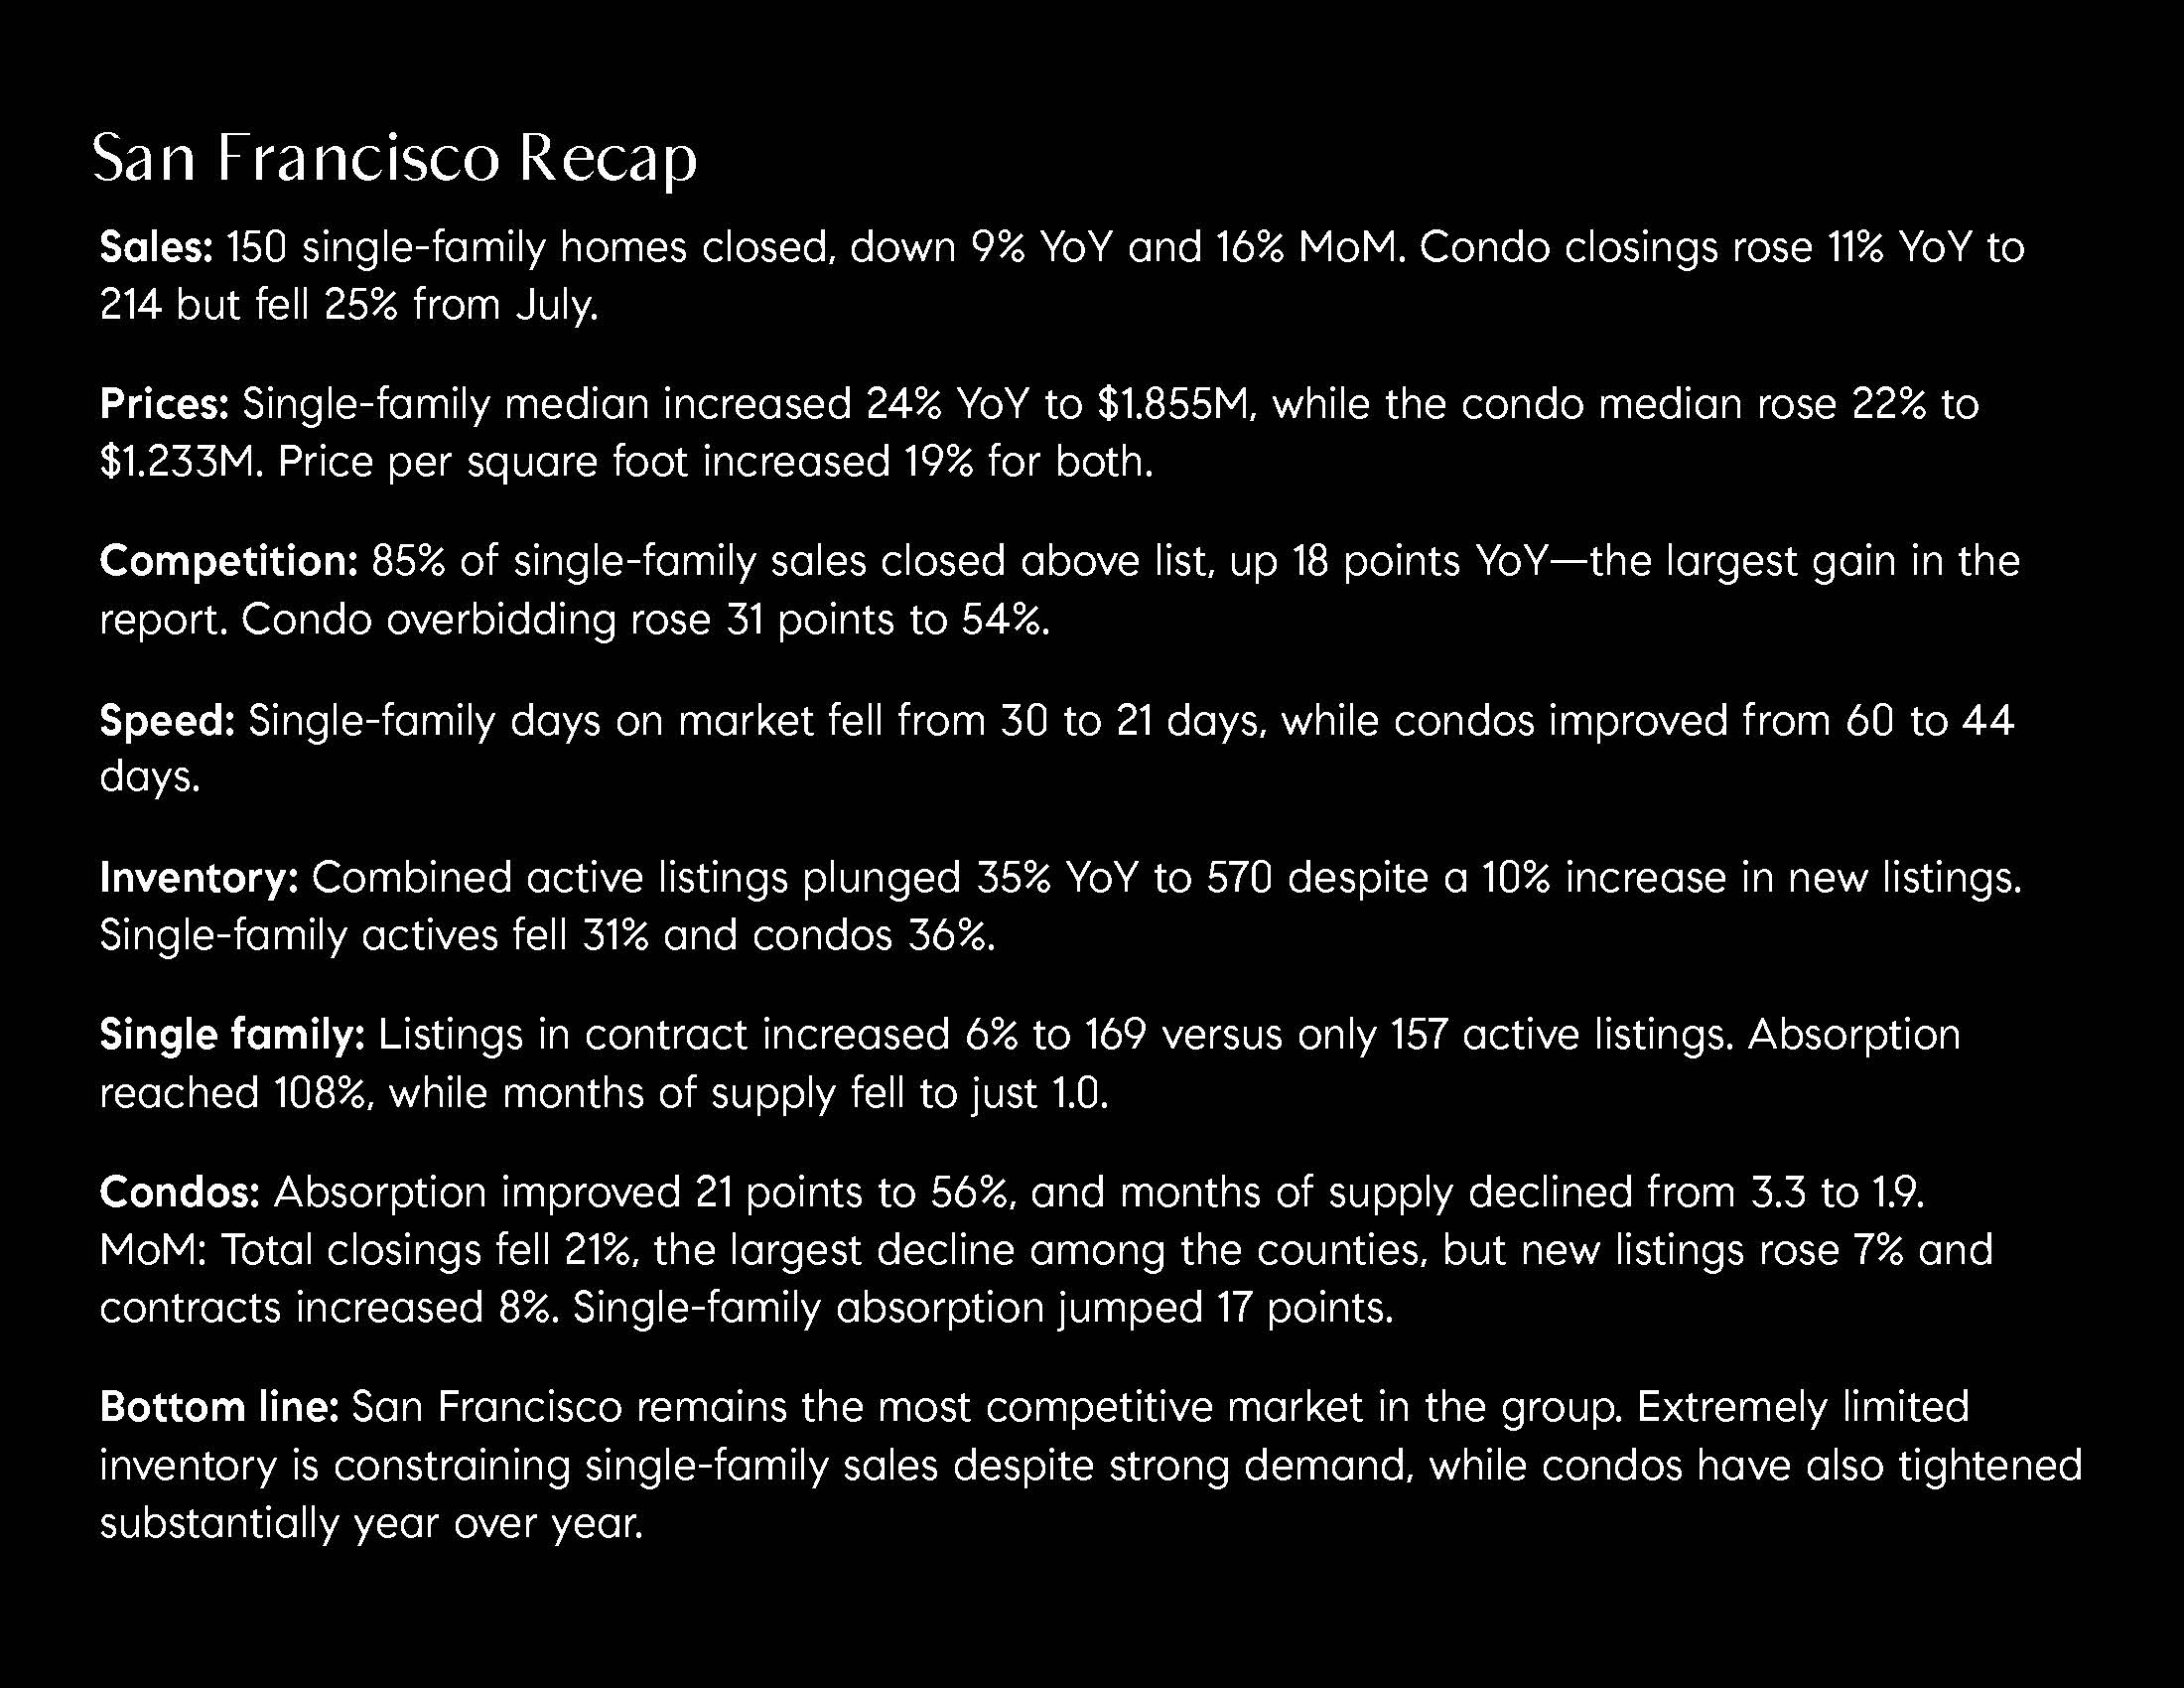
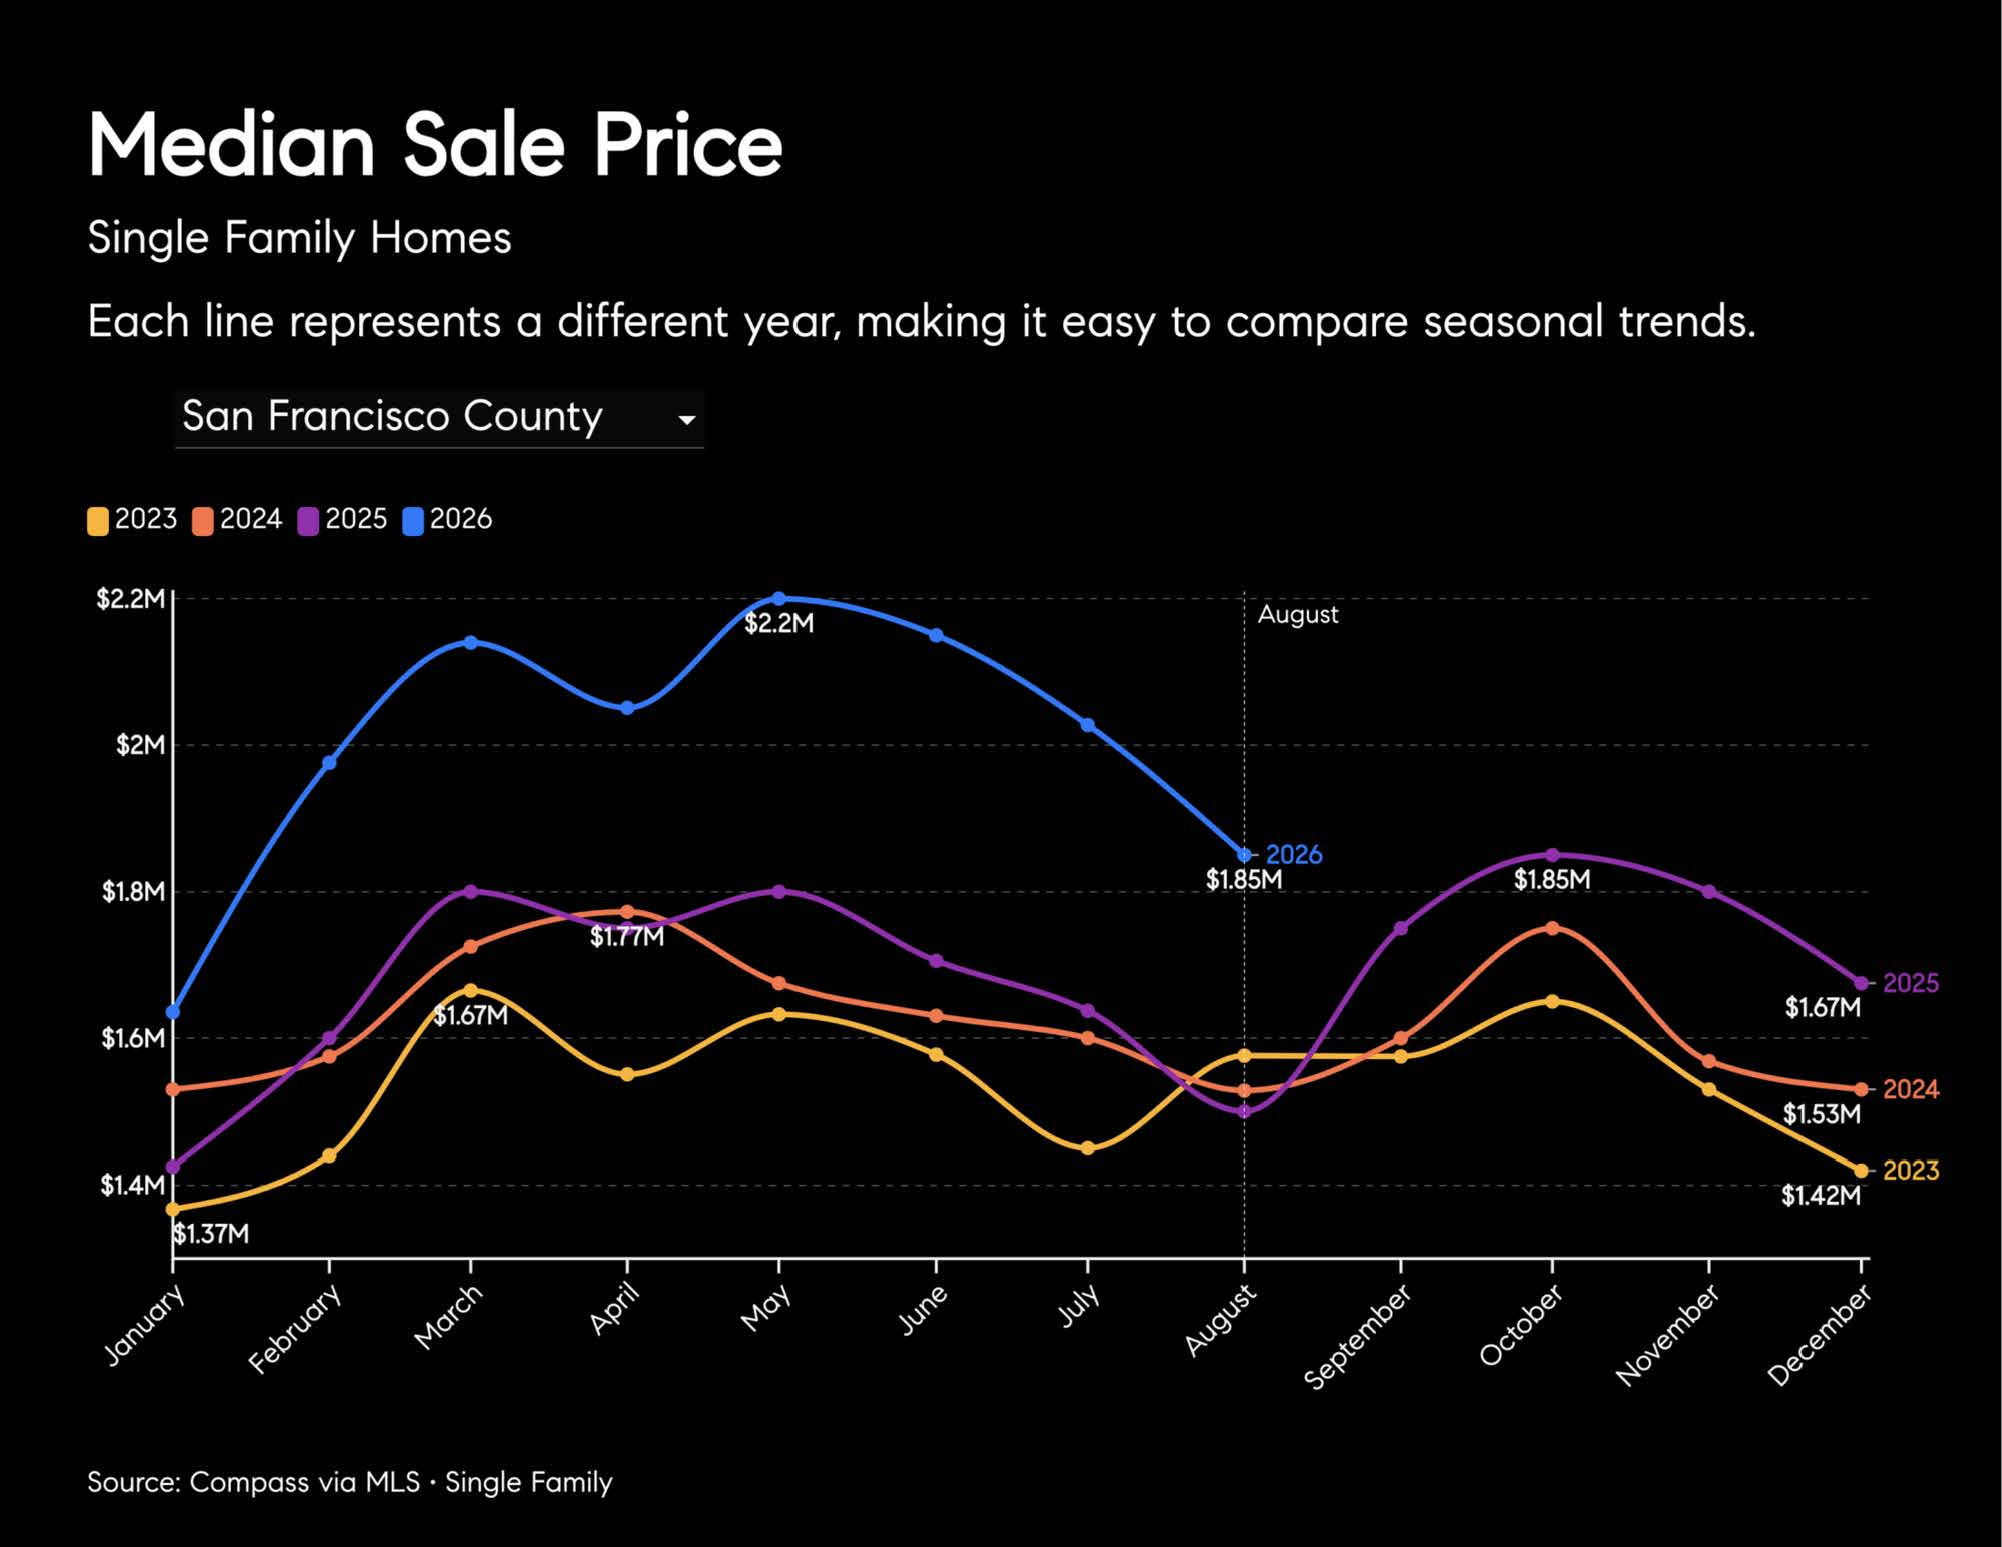
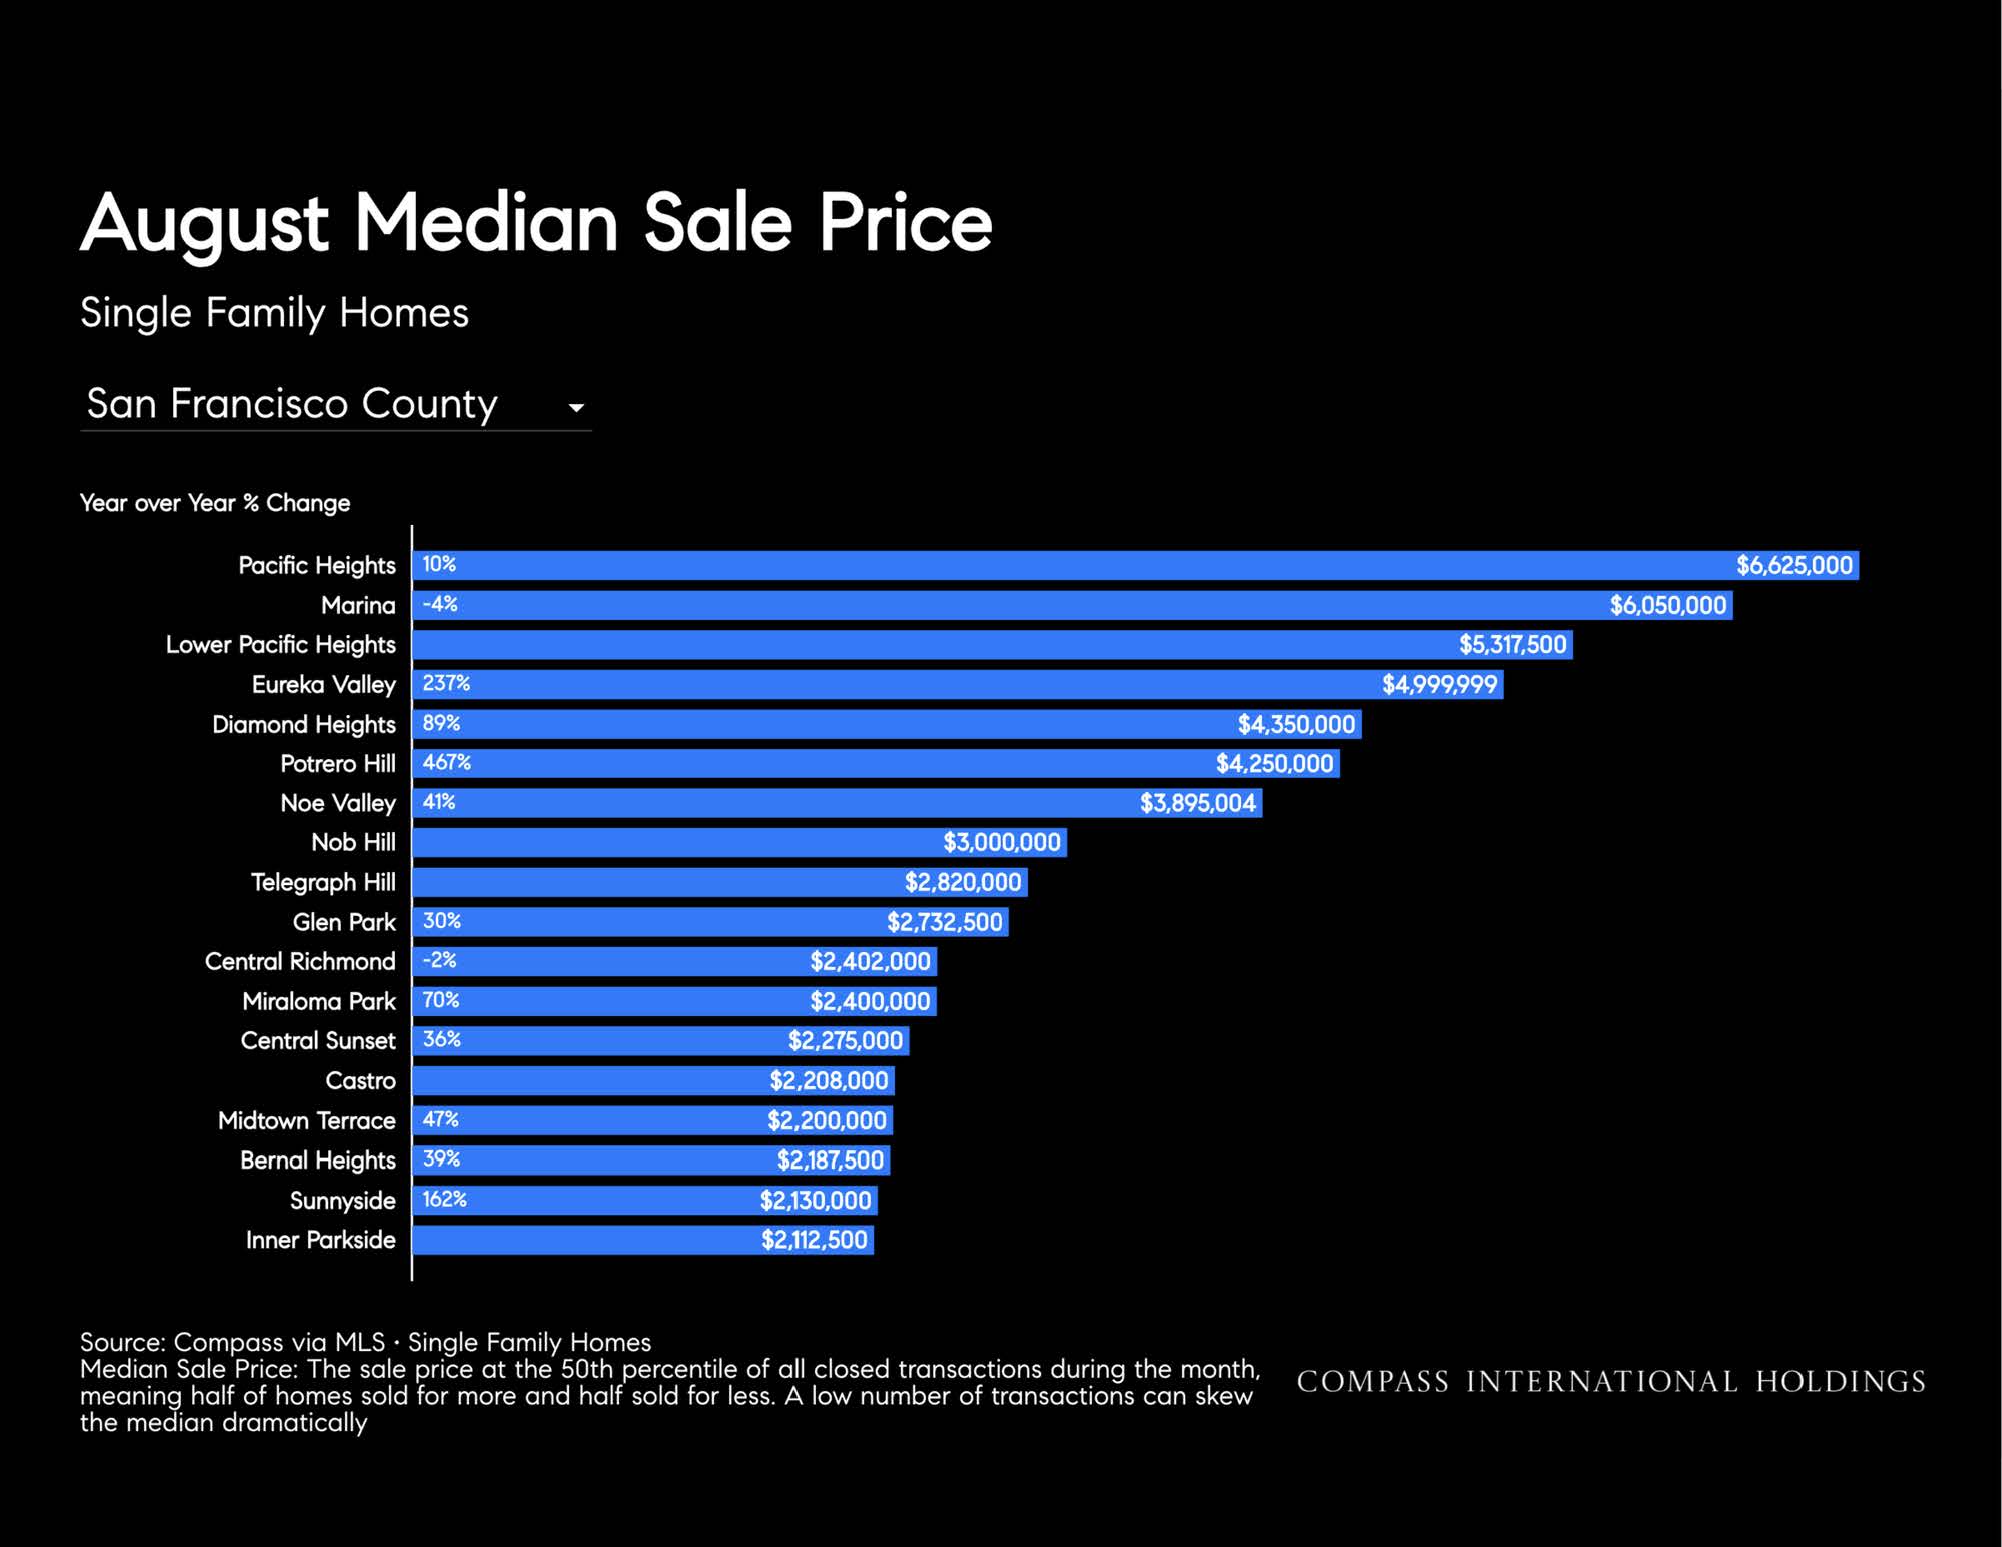
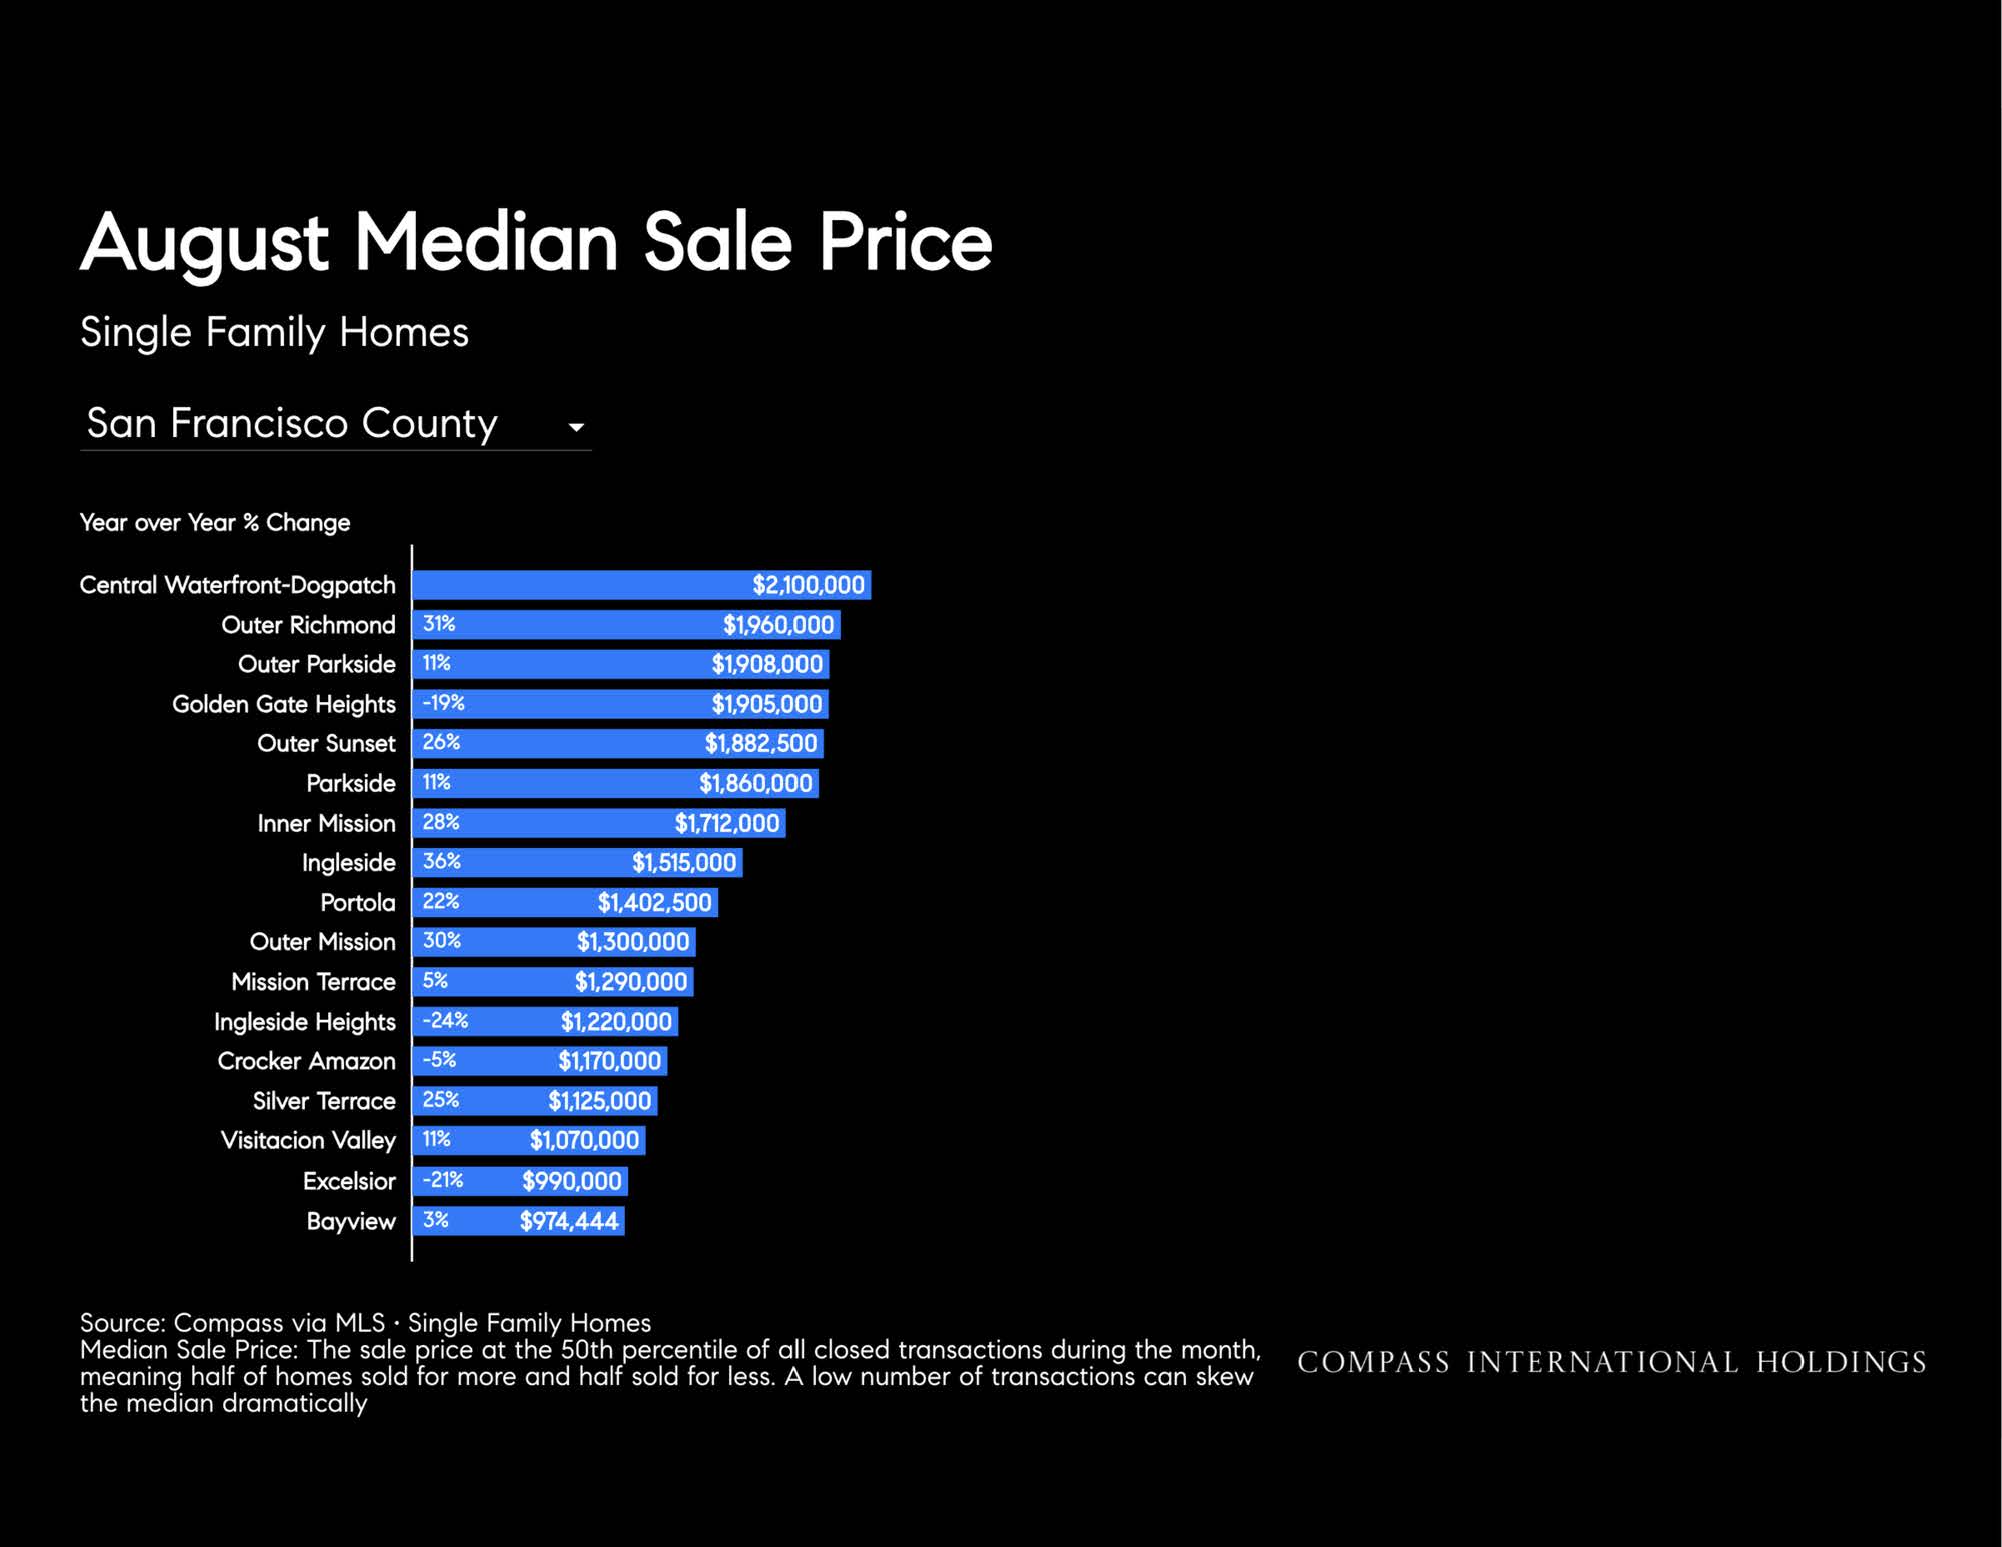
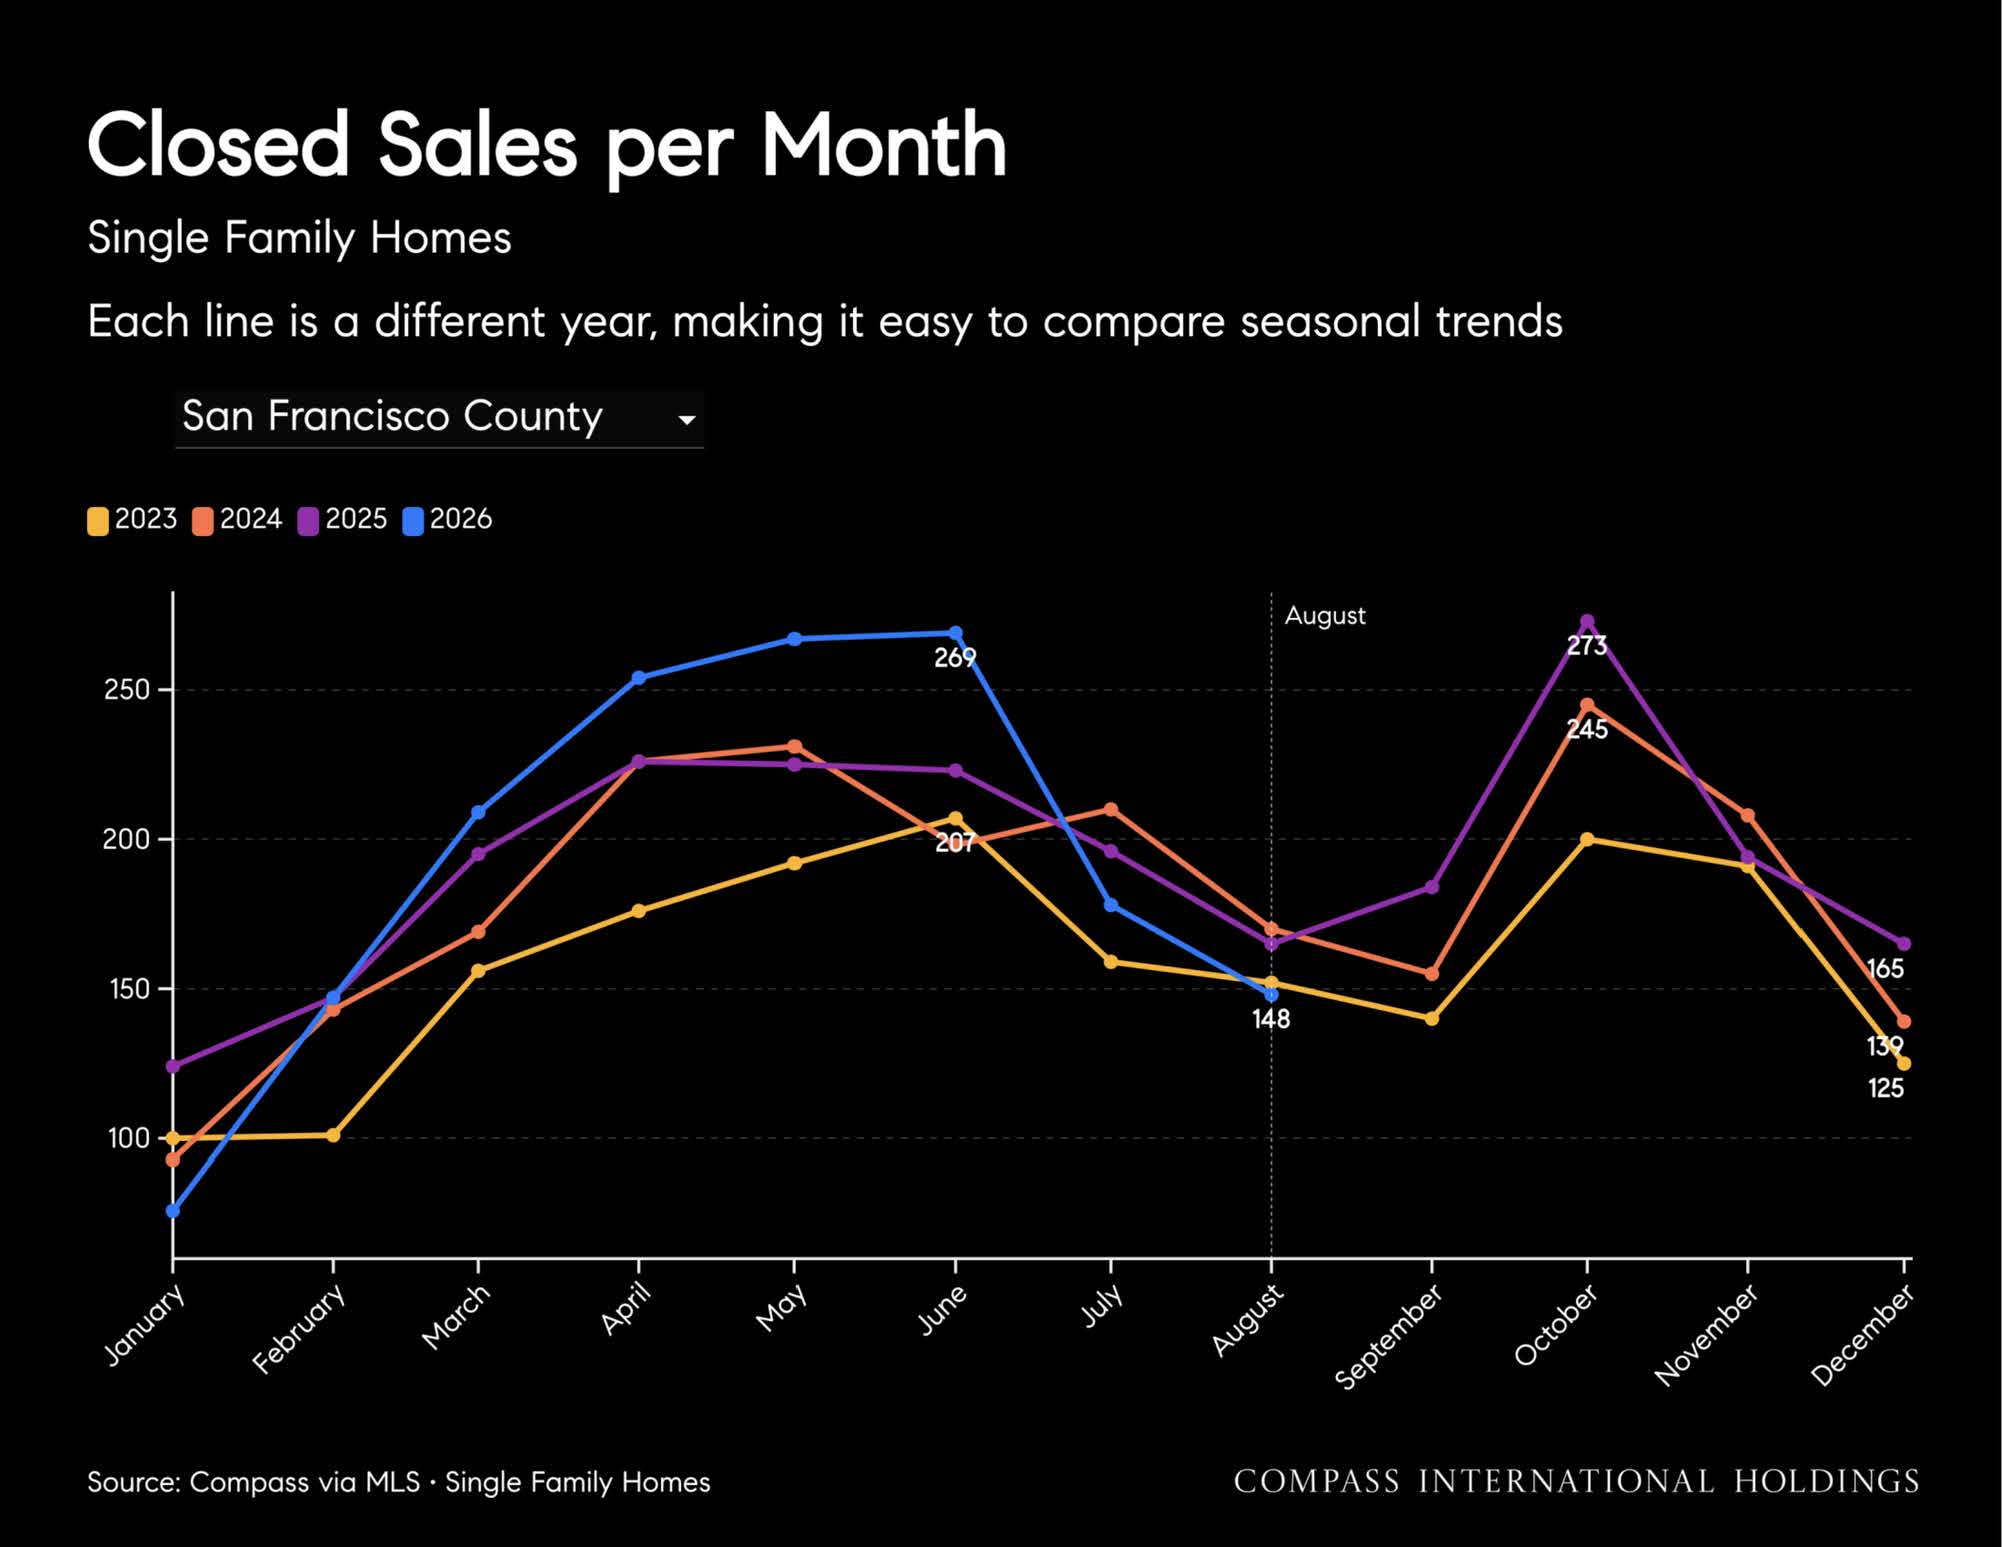
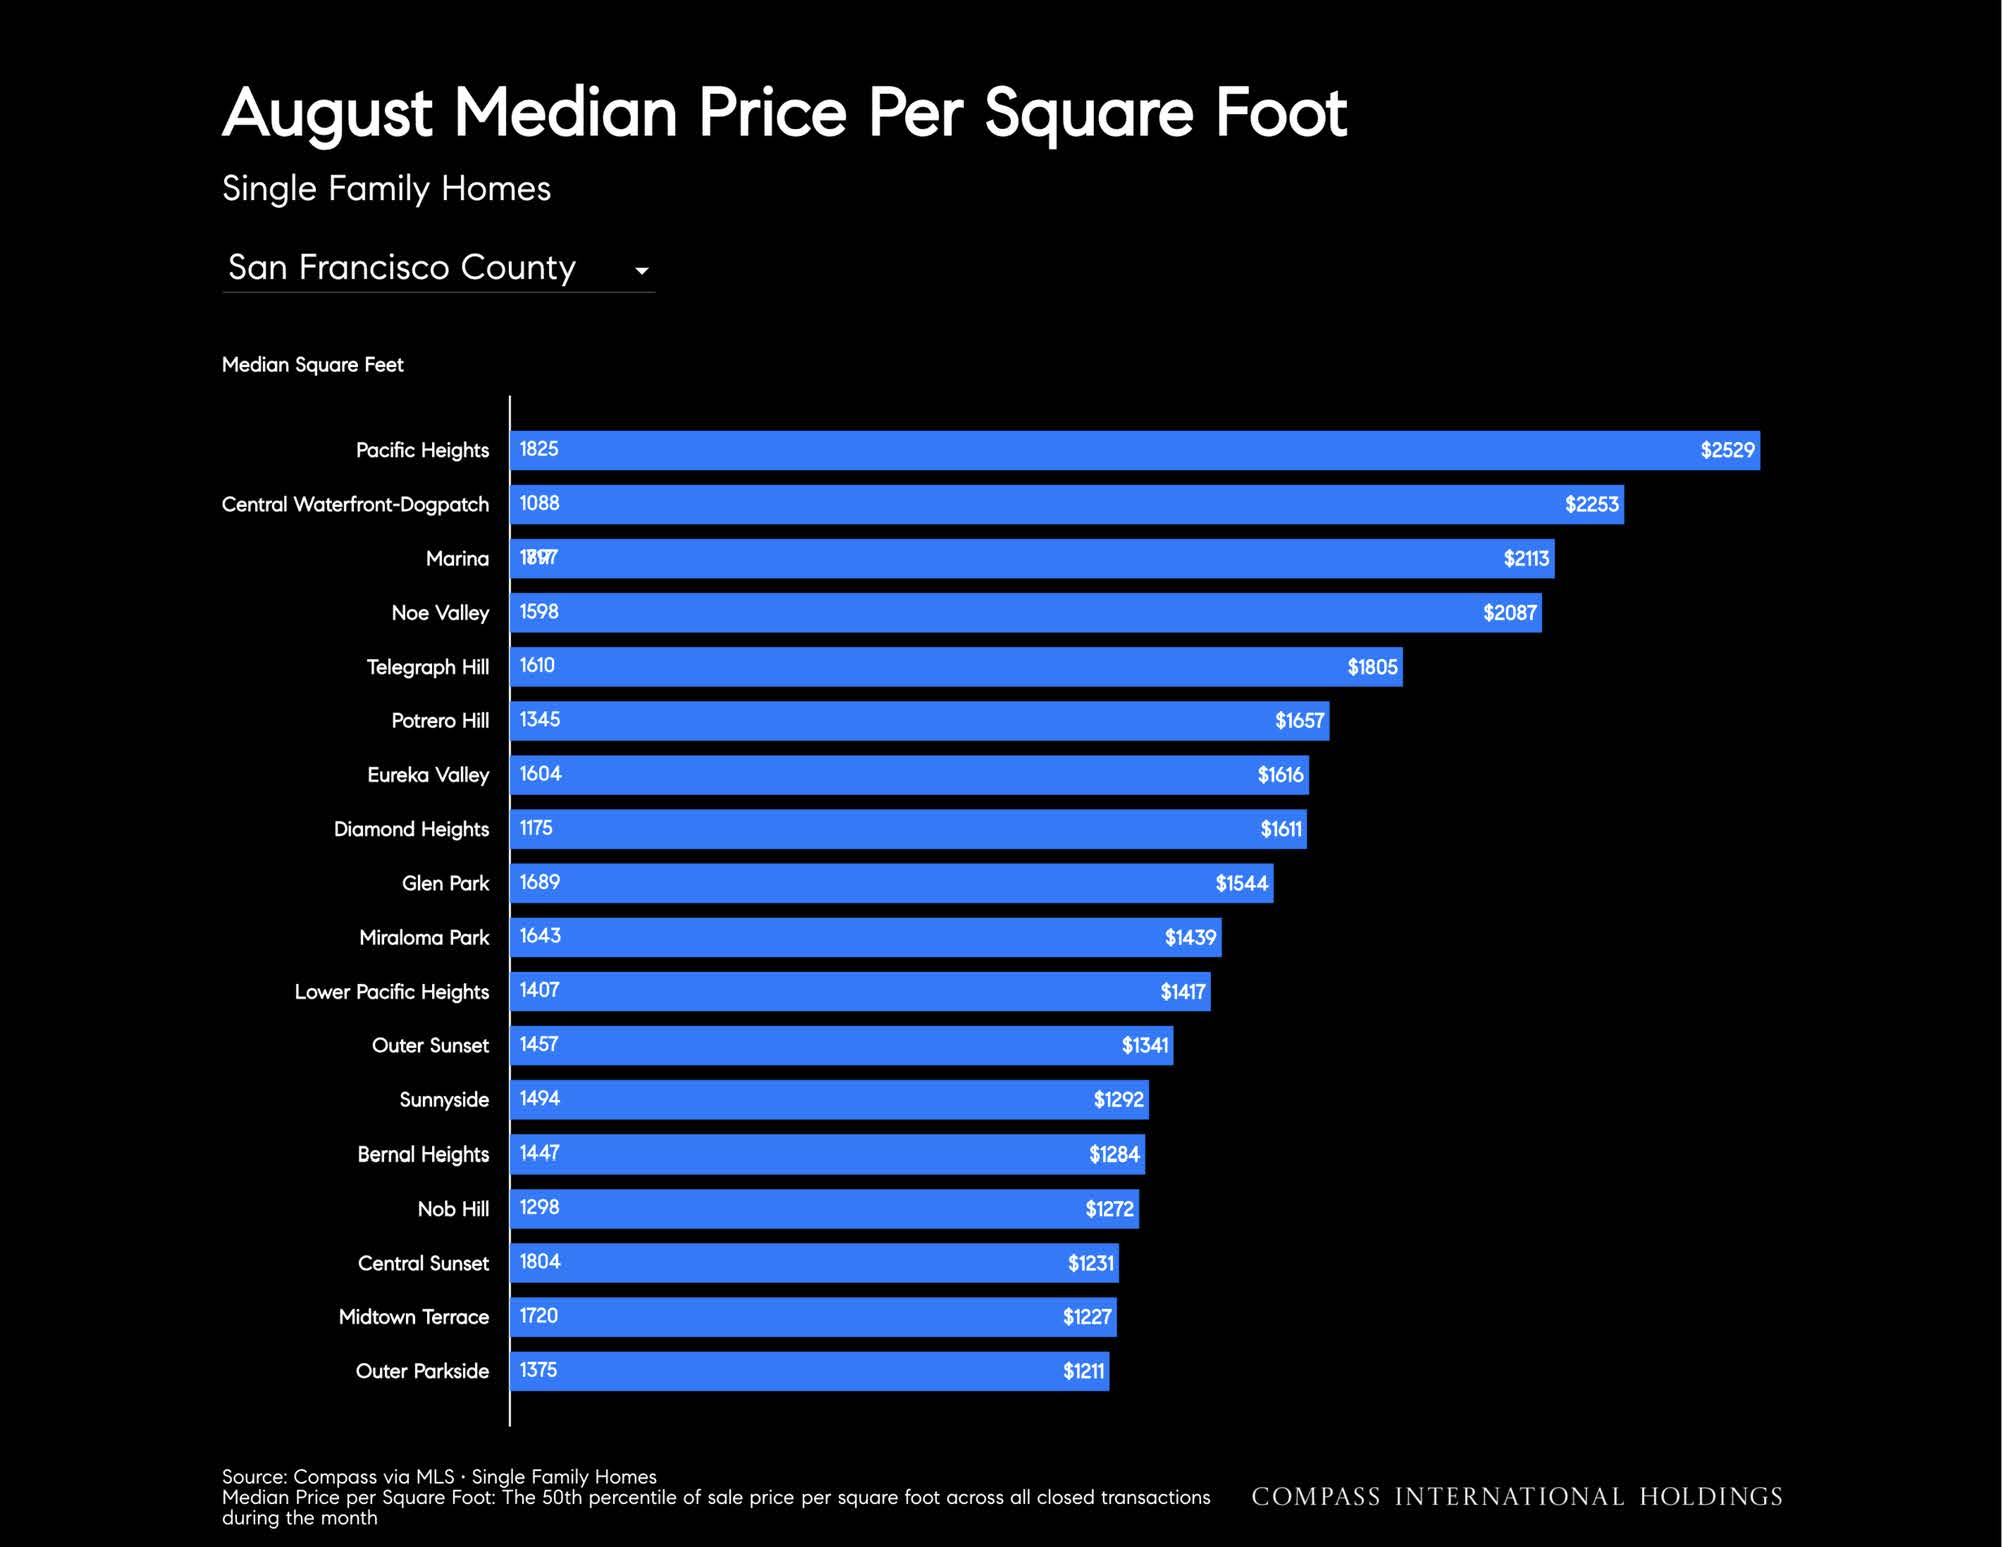
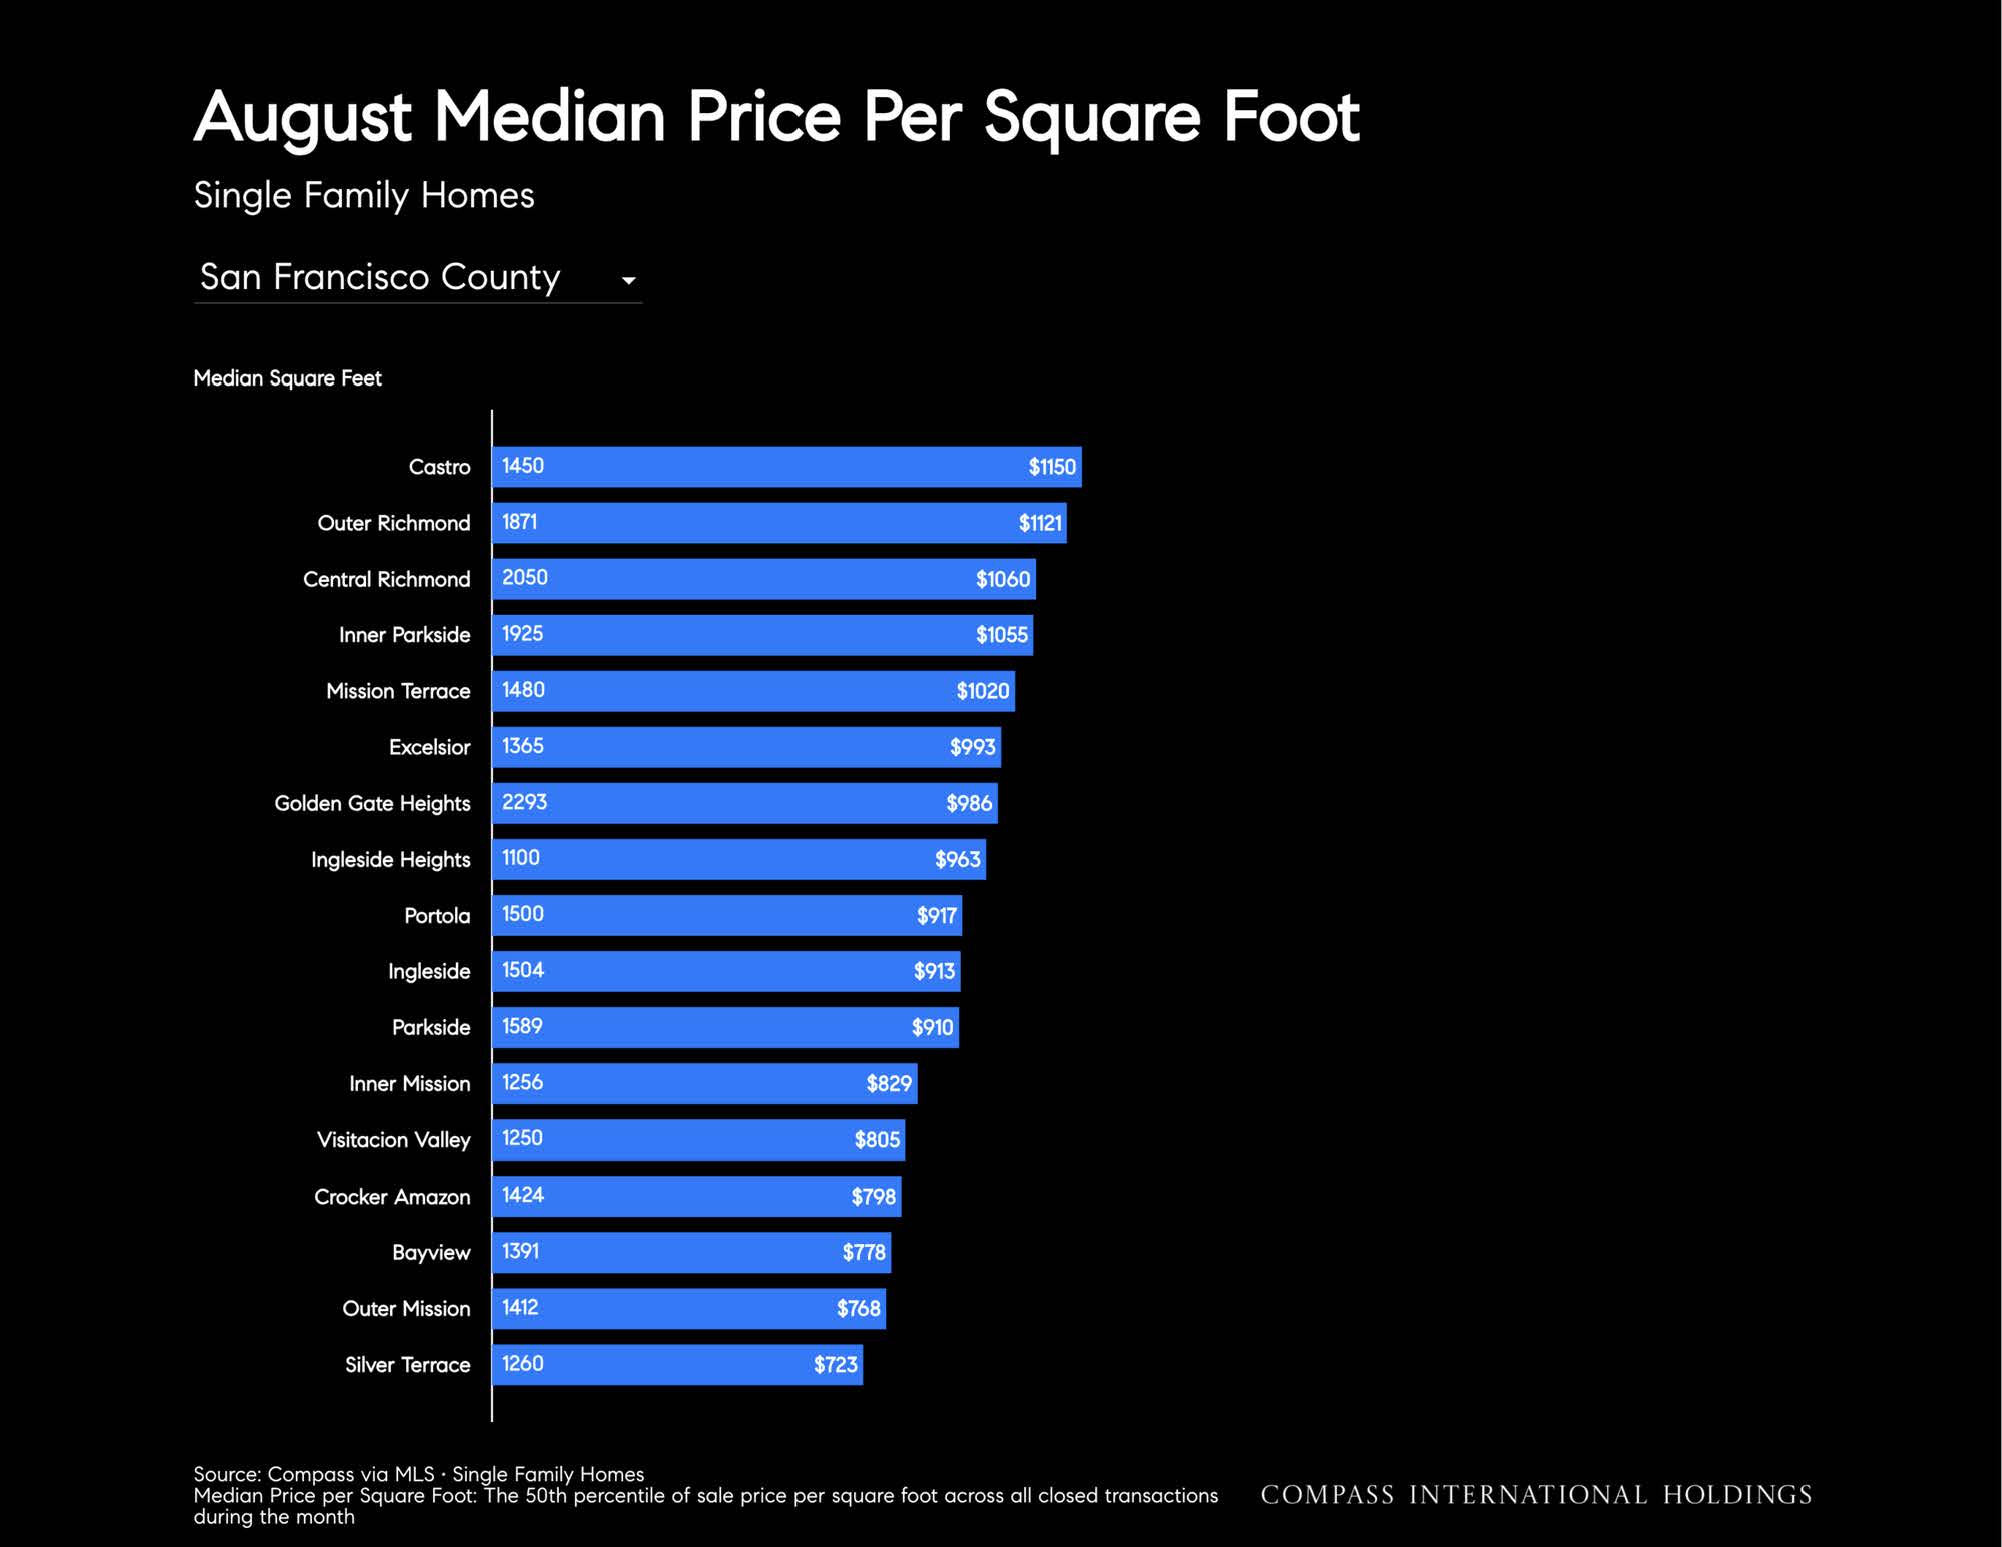
Here's some quick year-over-year figures based on San Francisco's most recent data (compiled end of August):
Single-family homes
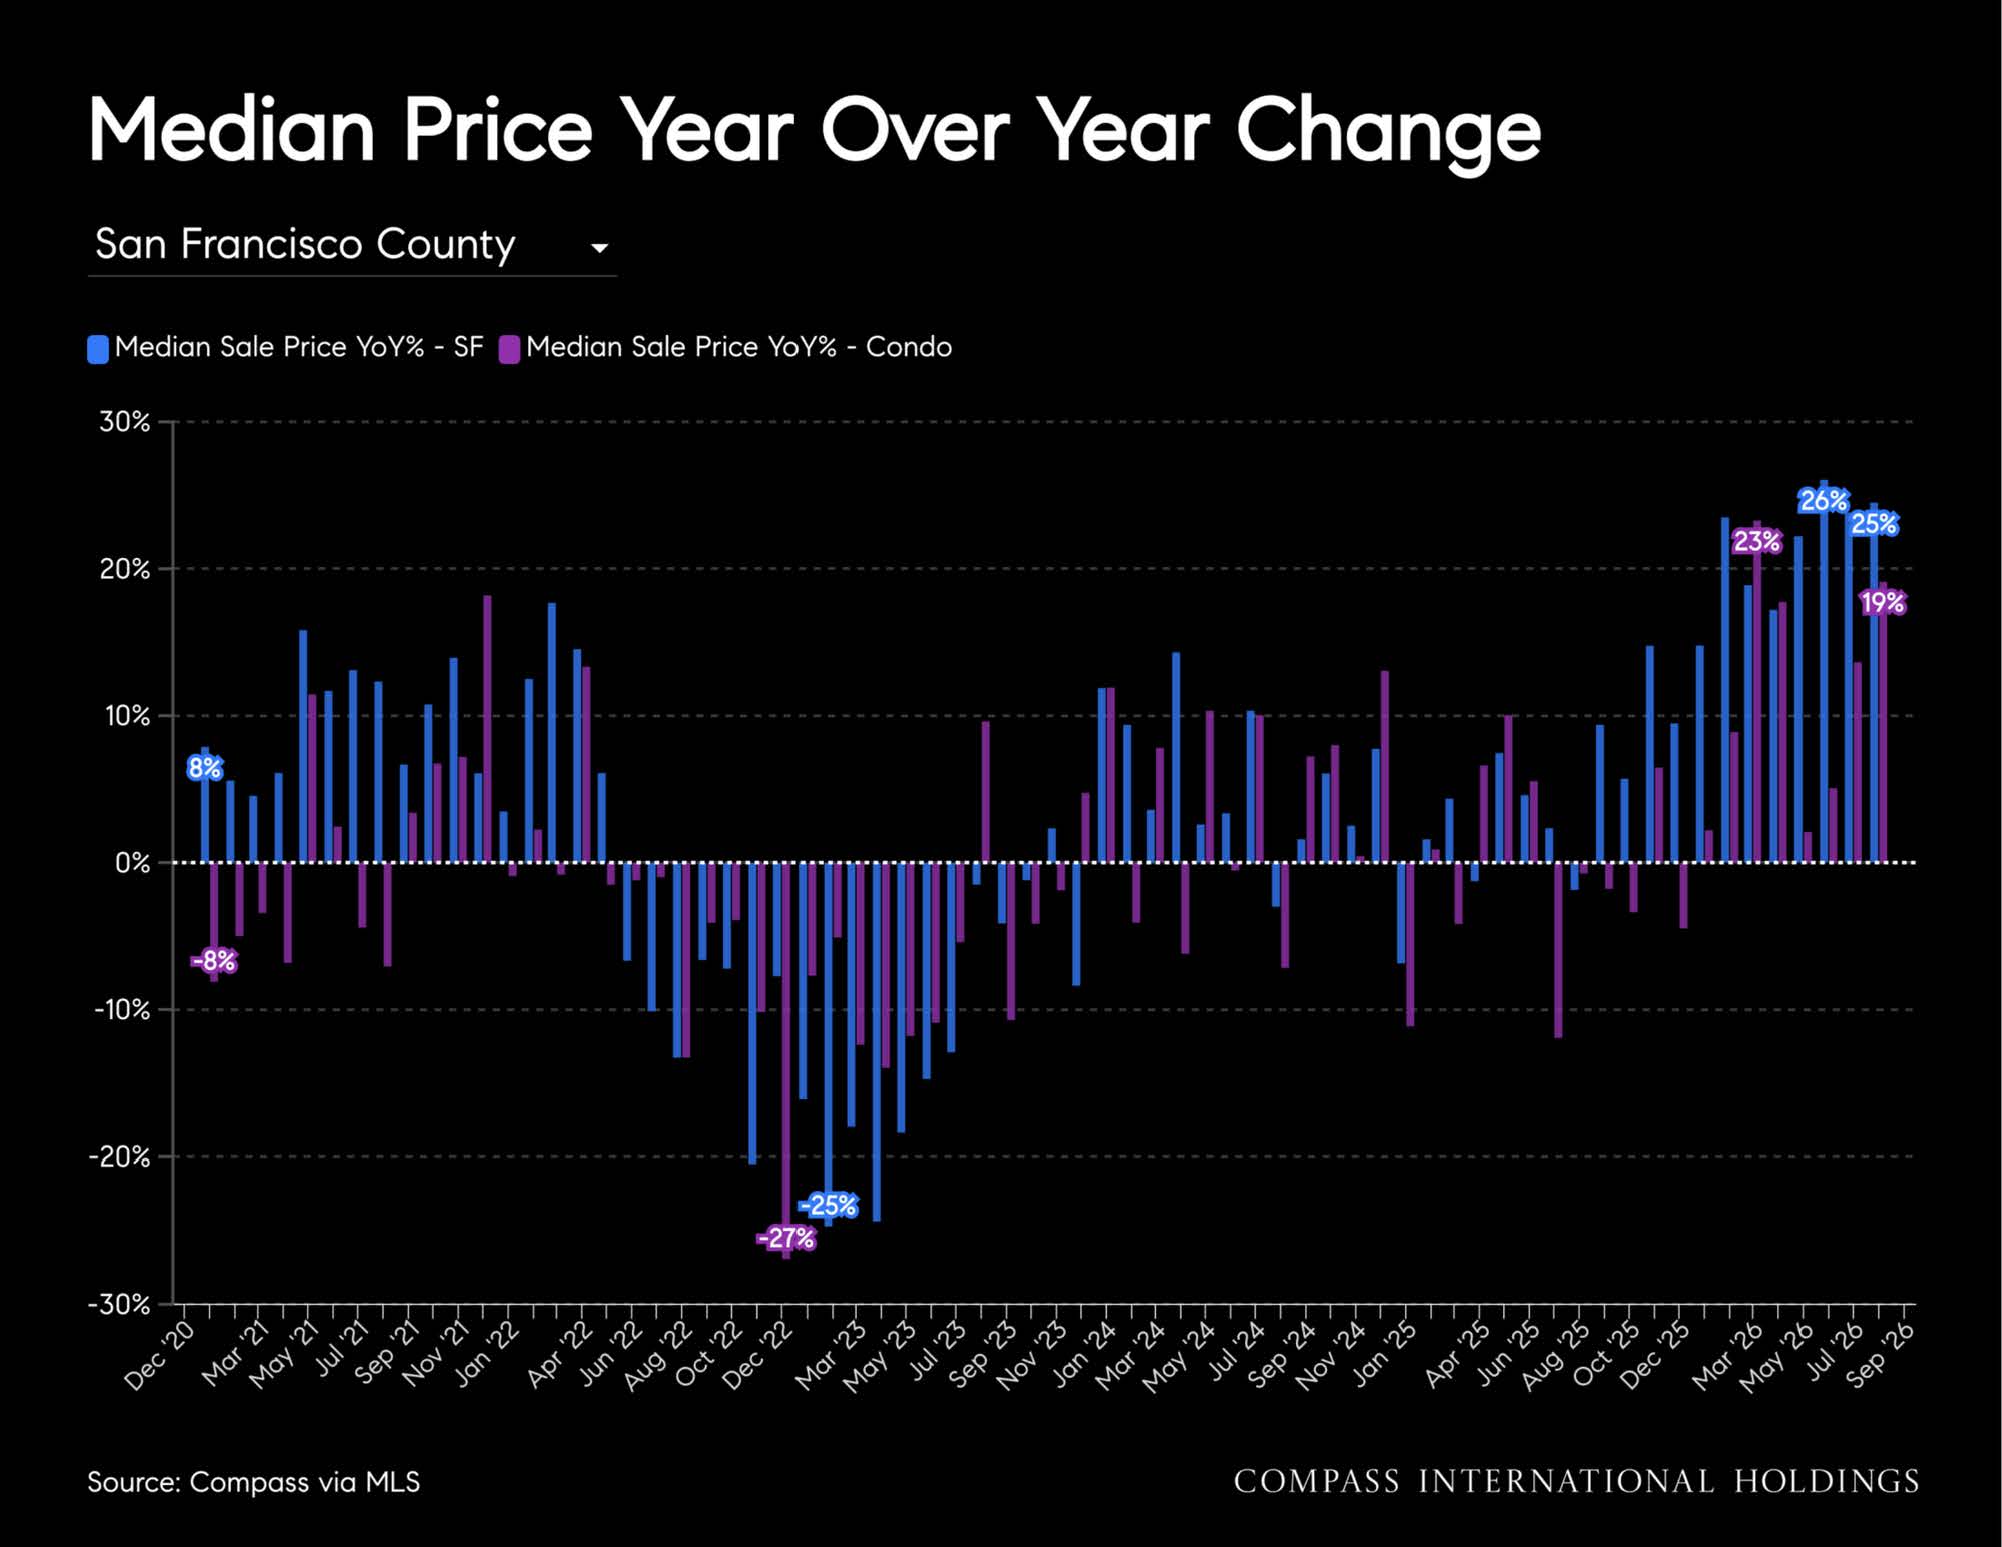
Median price is +23.3% ($1,855,000)
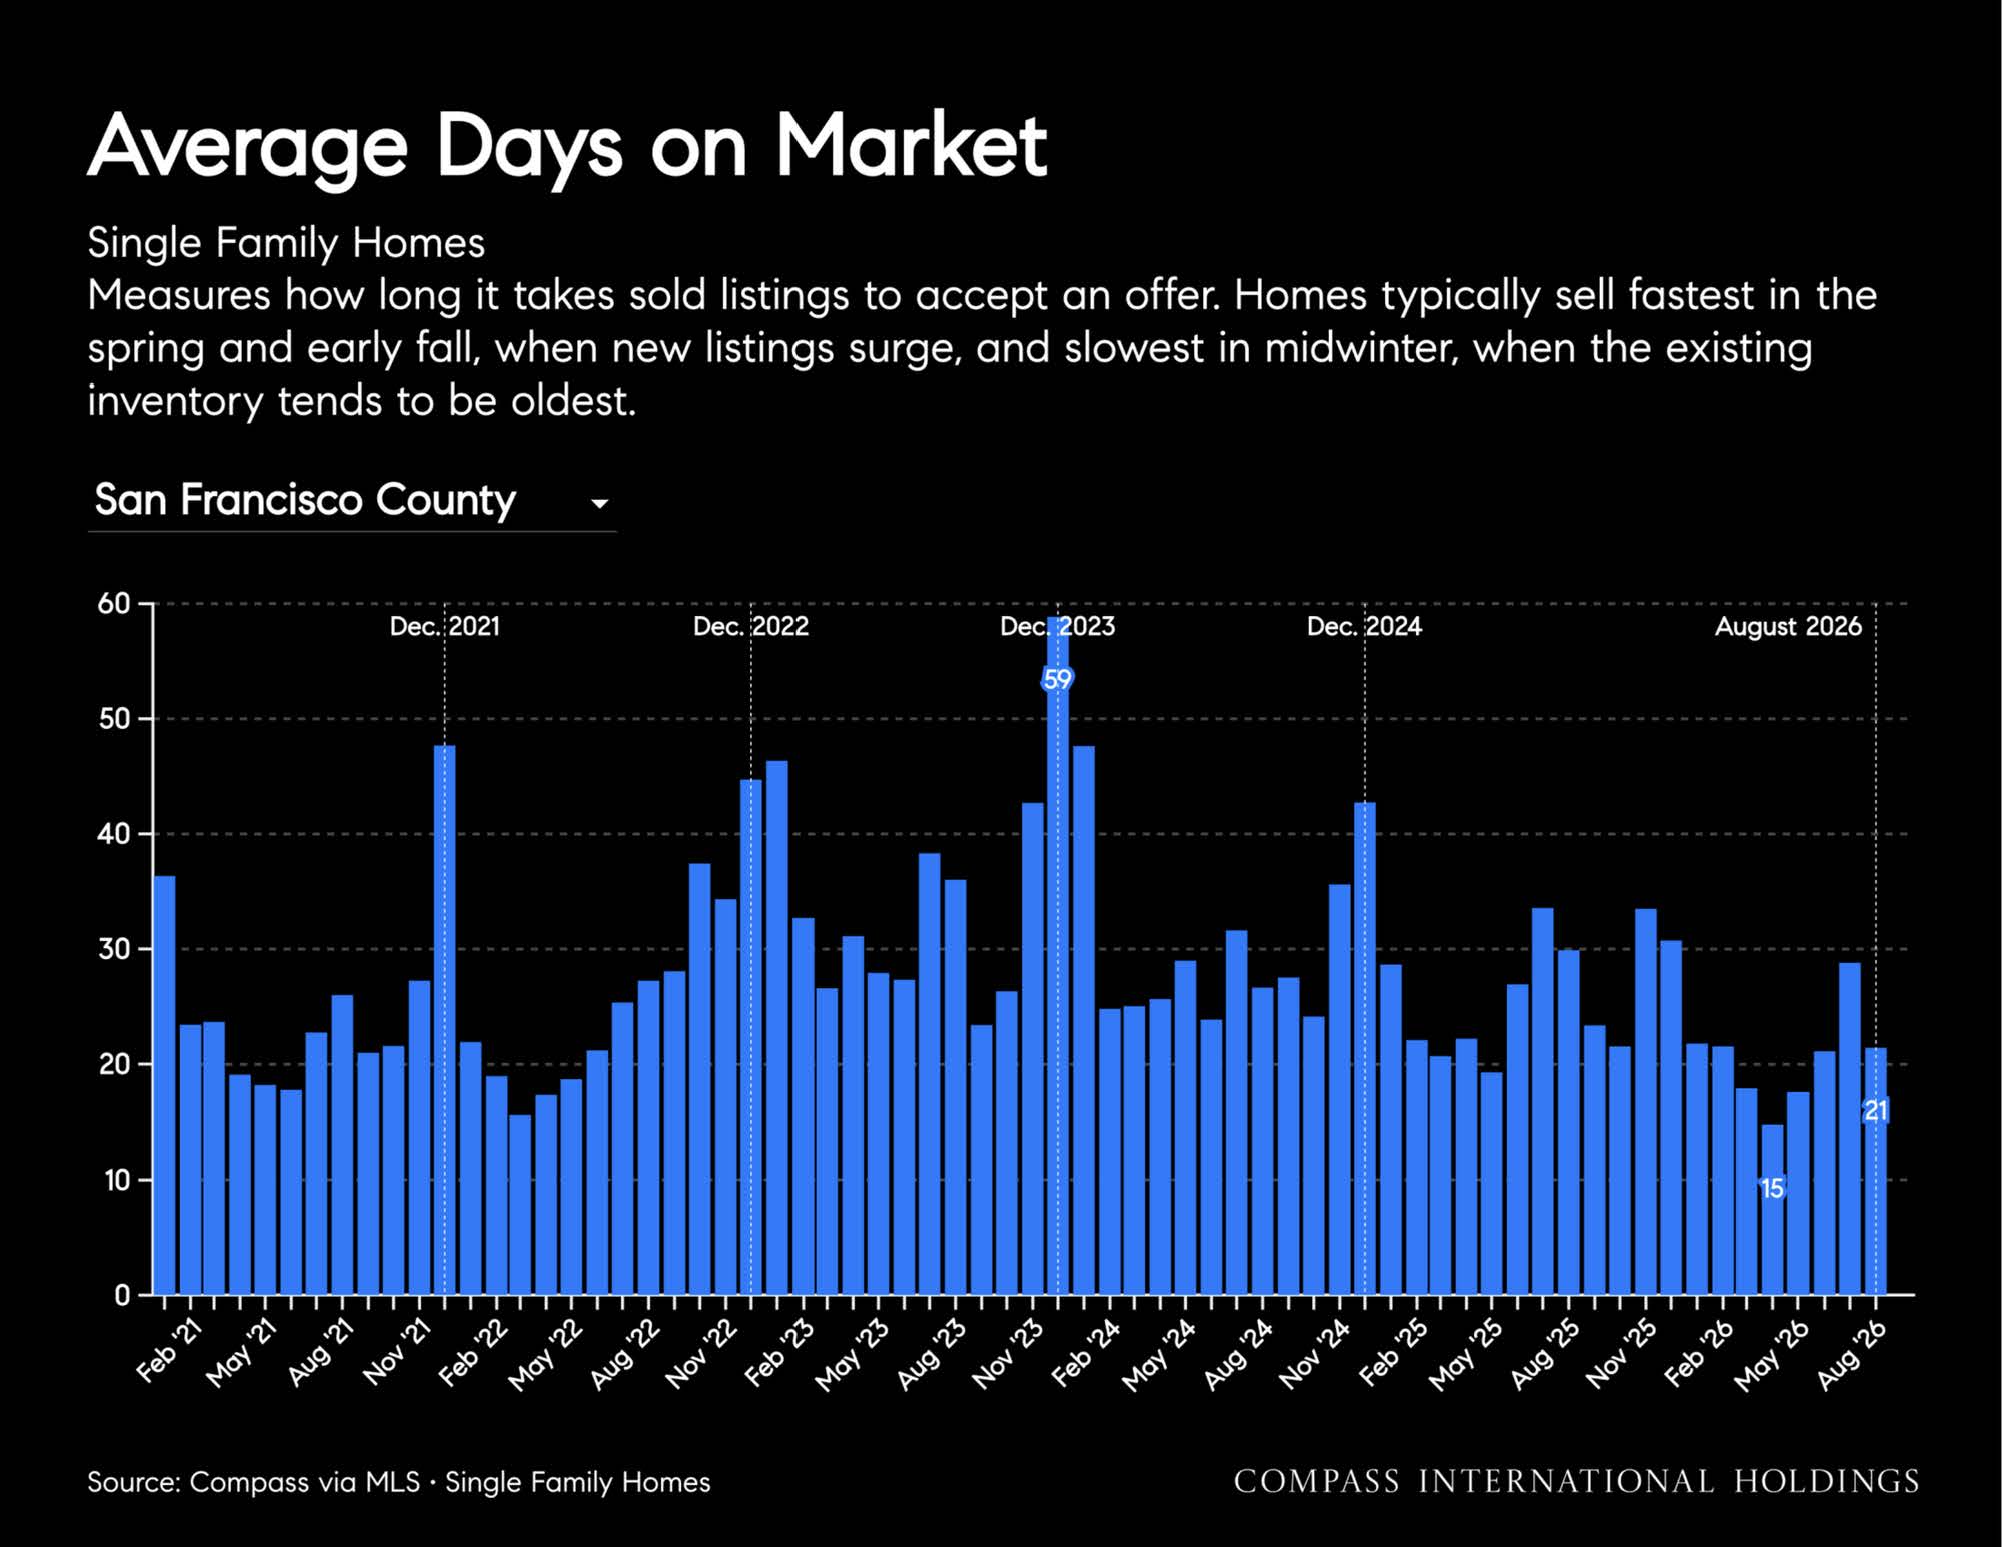
Days on Market are -18.8% to 13 (typical 2 weekends then offer date)
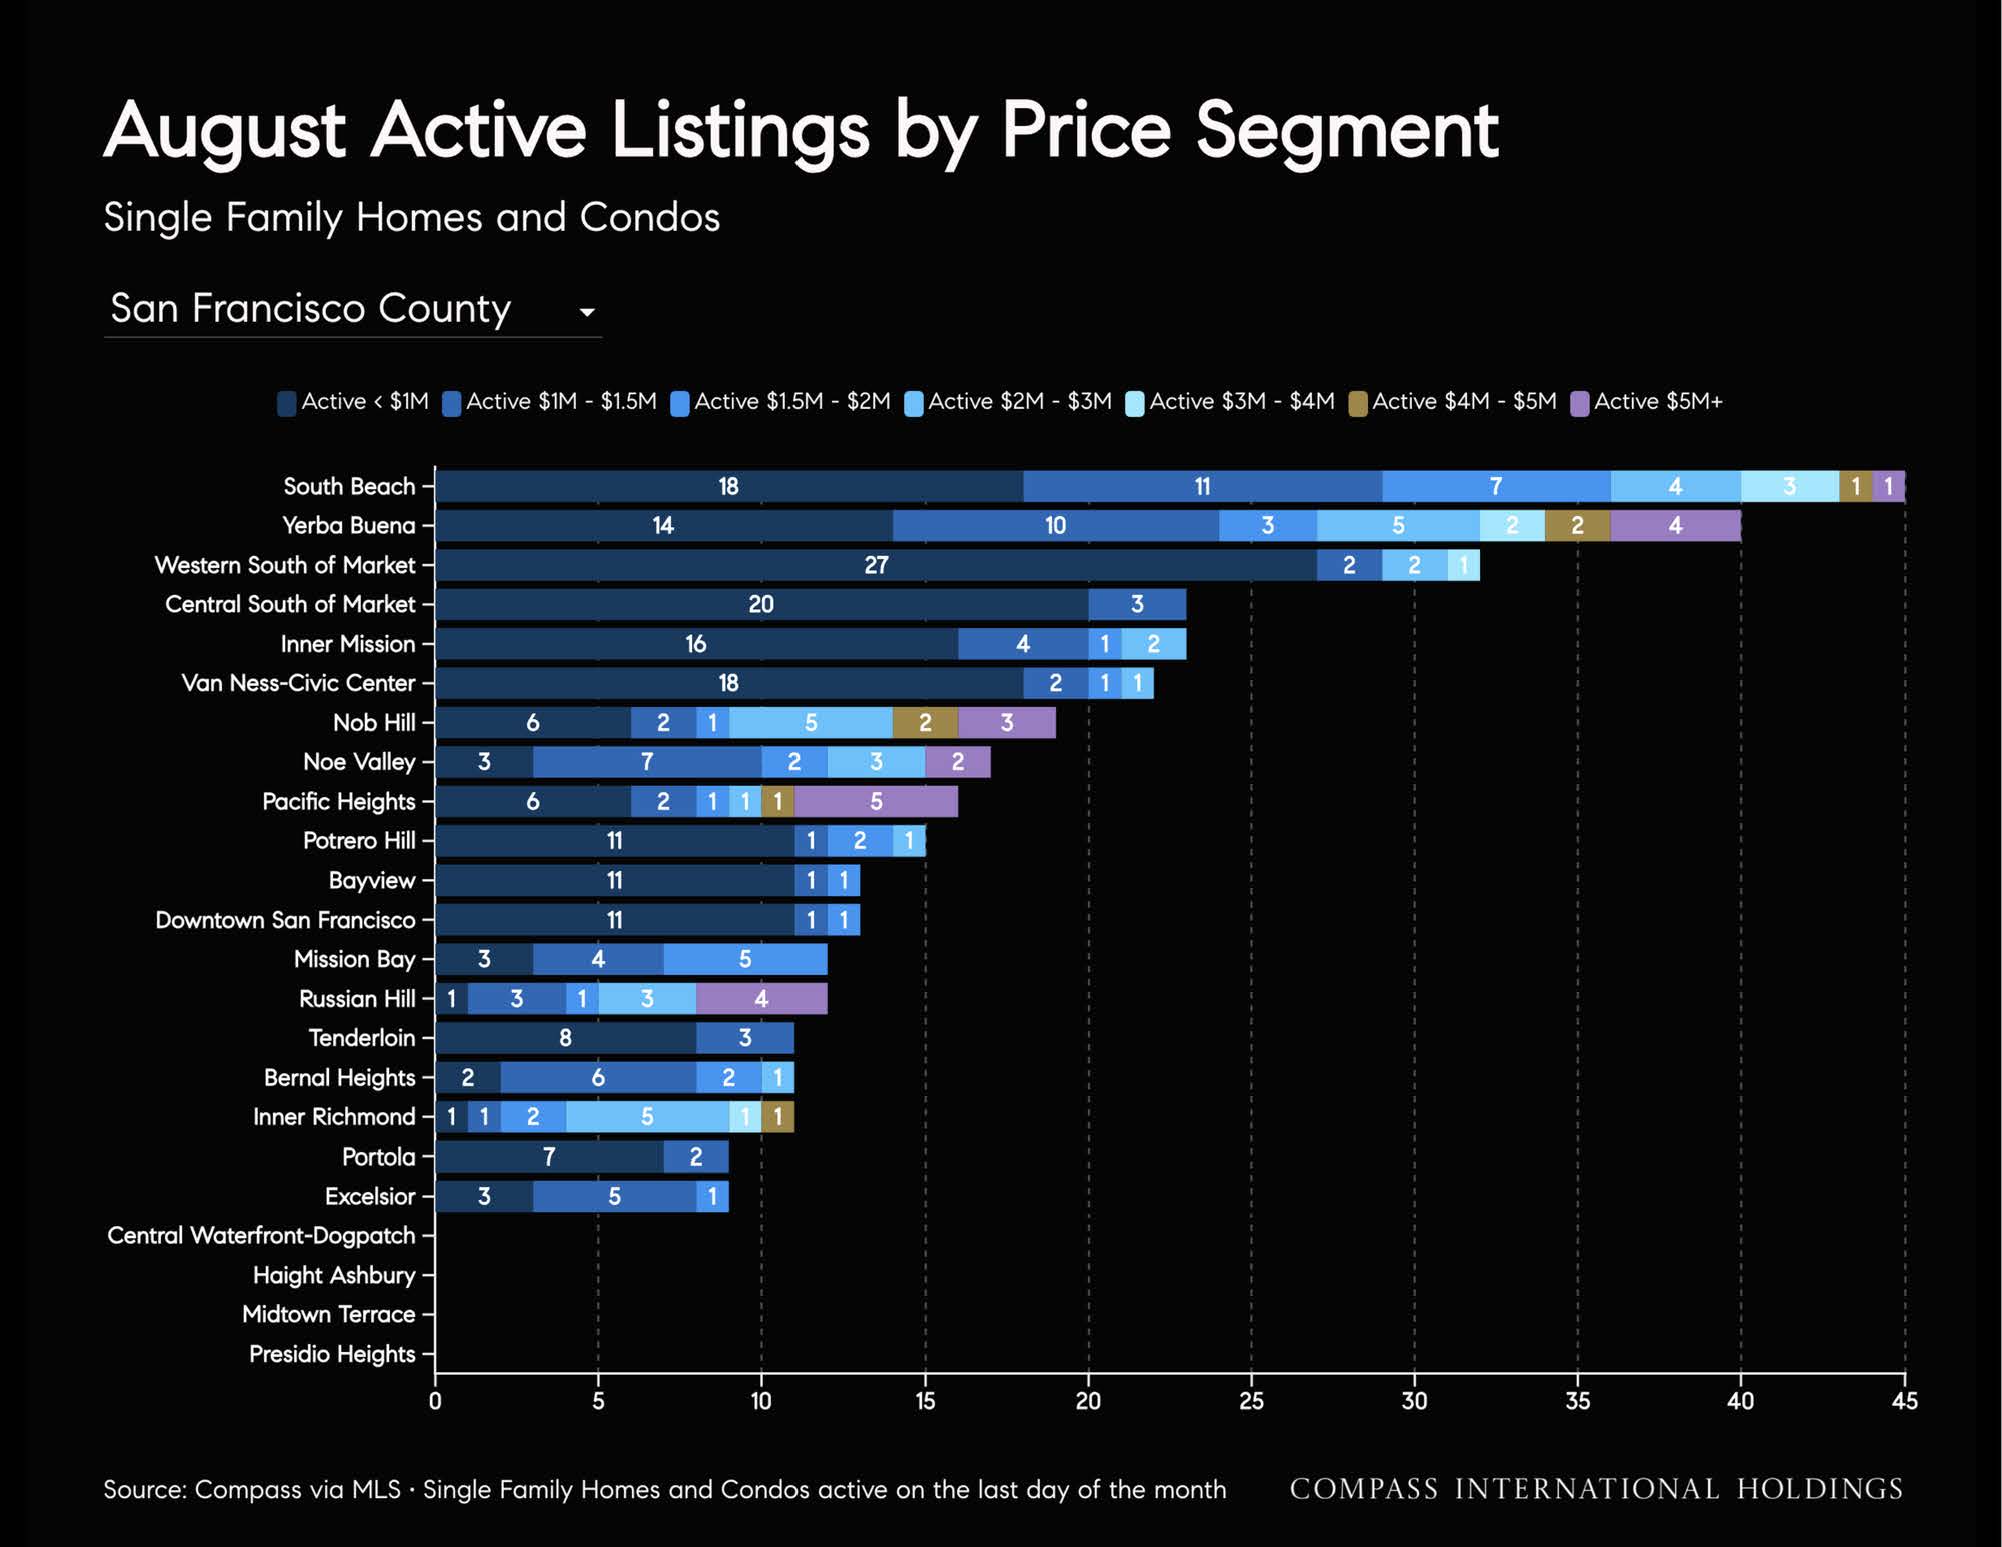
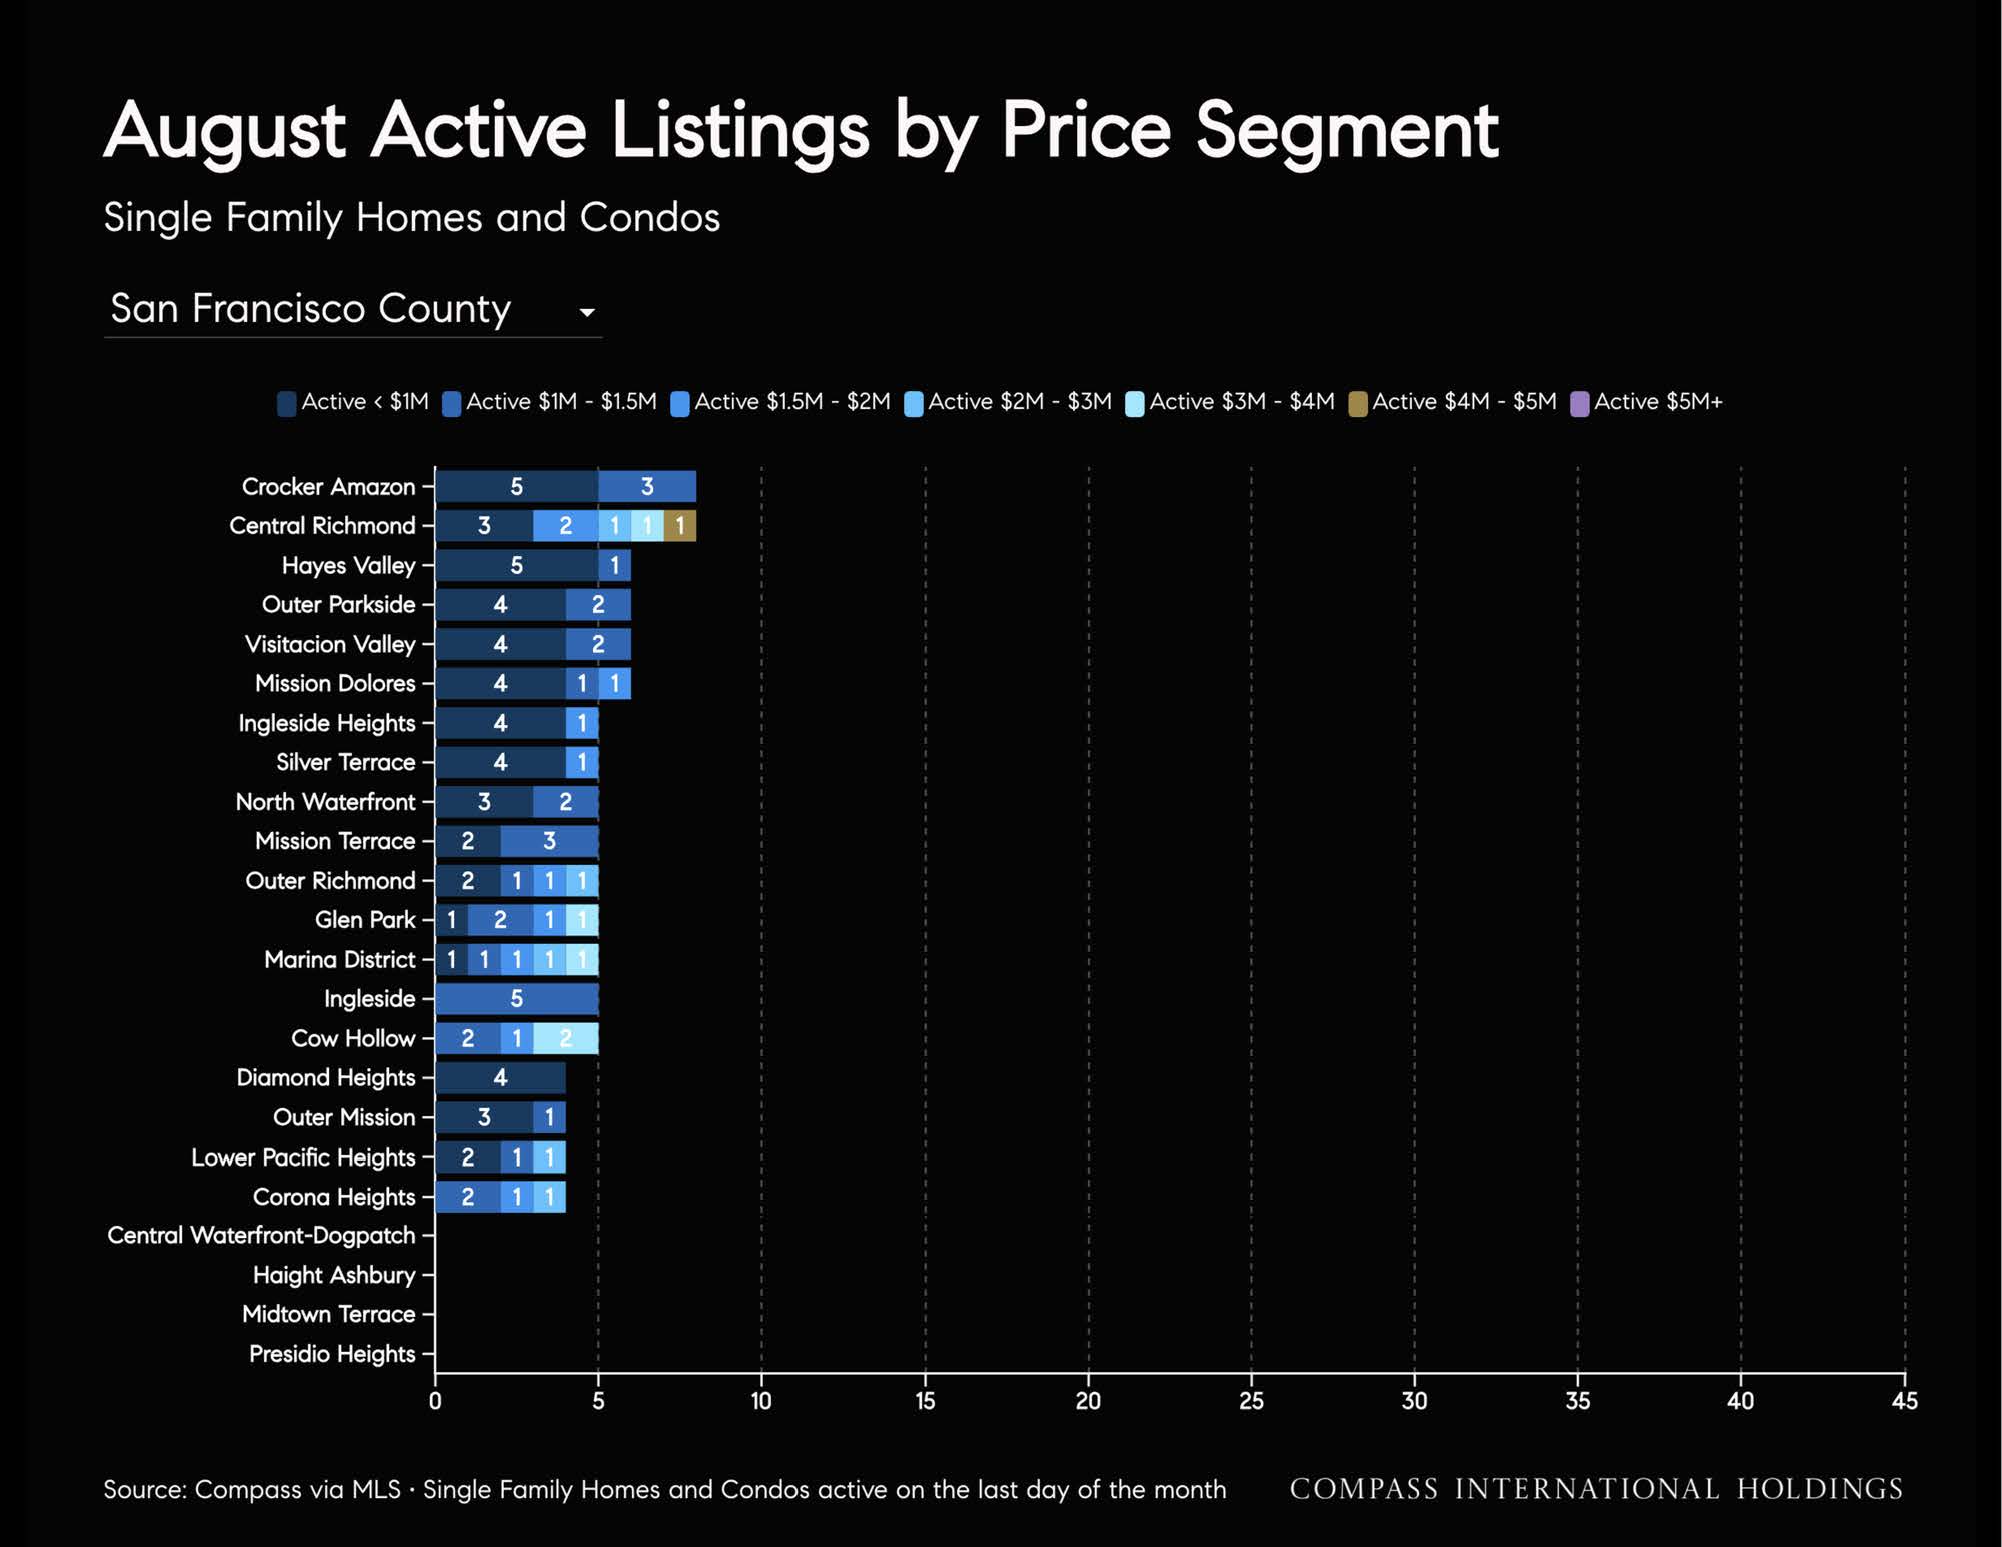
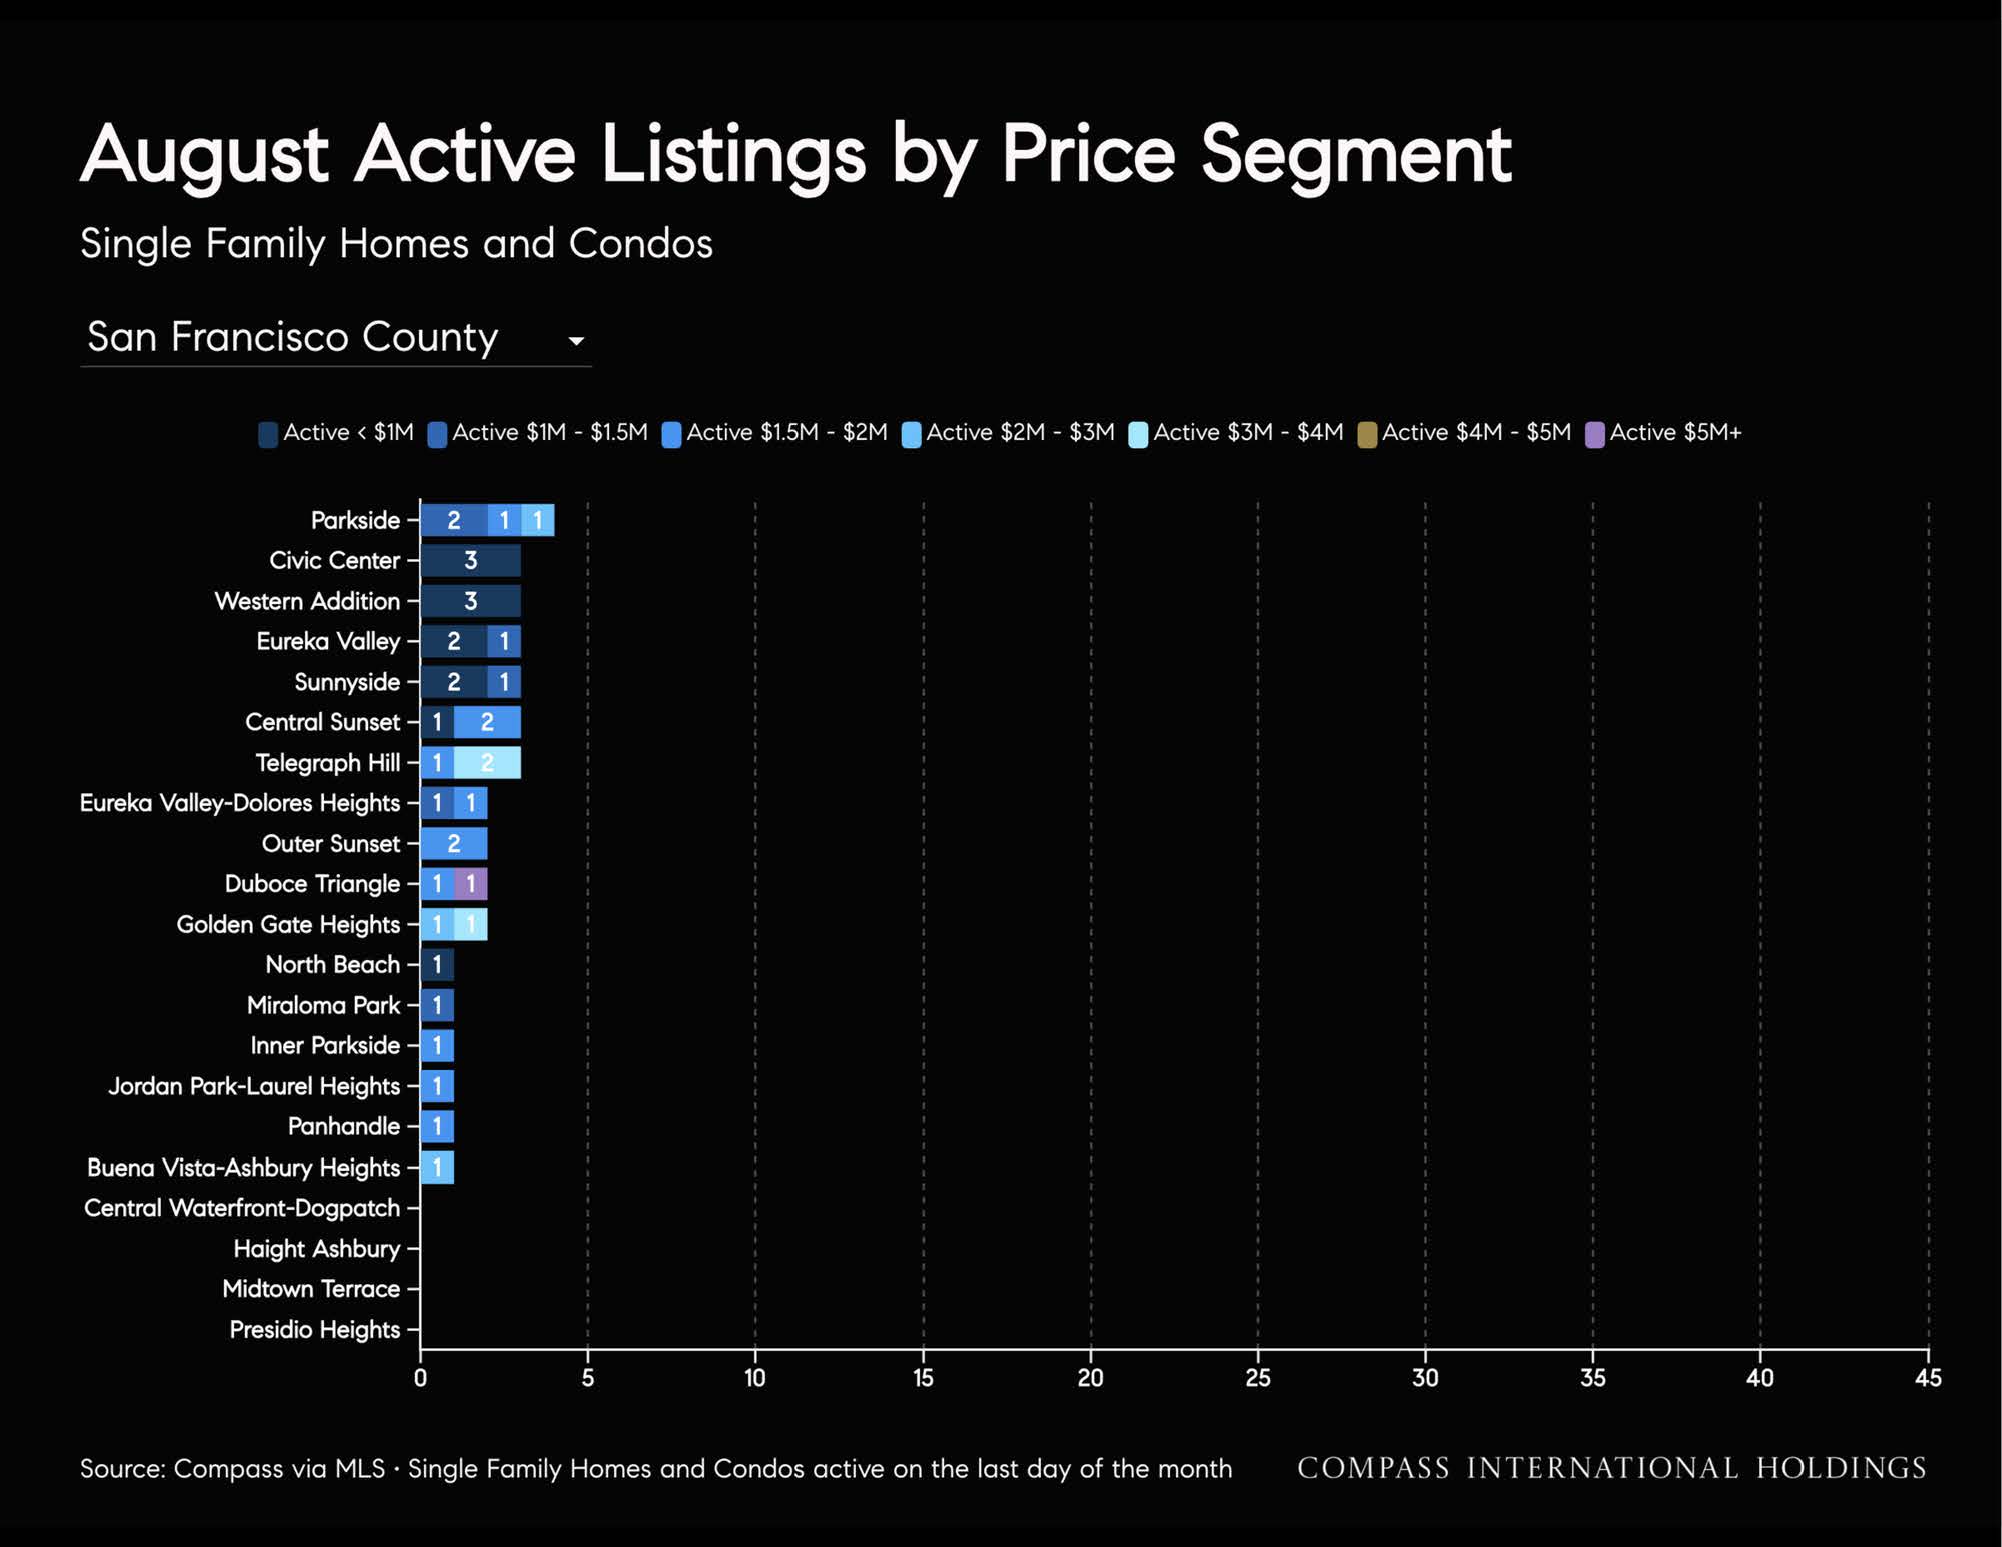
Active listings are -33%
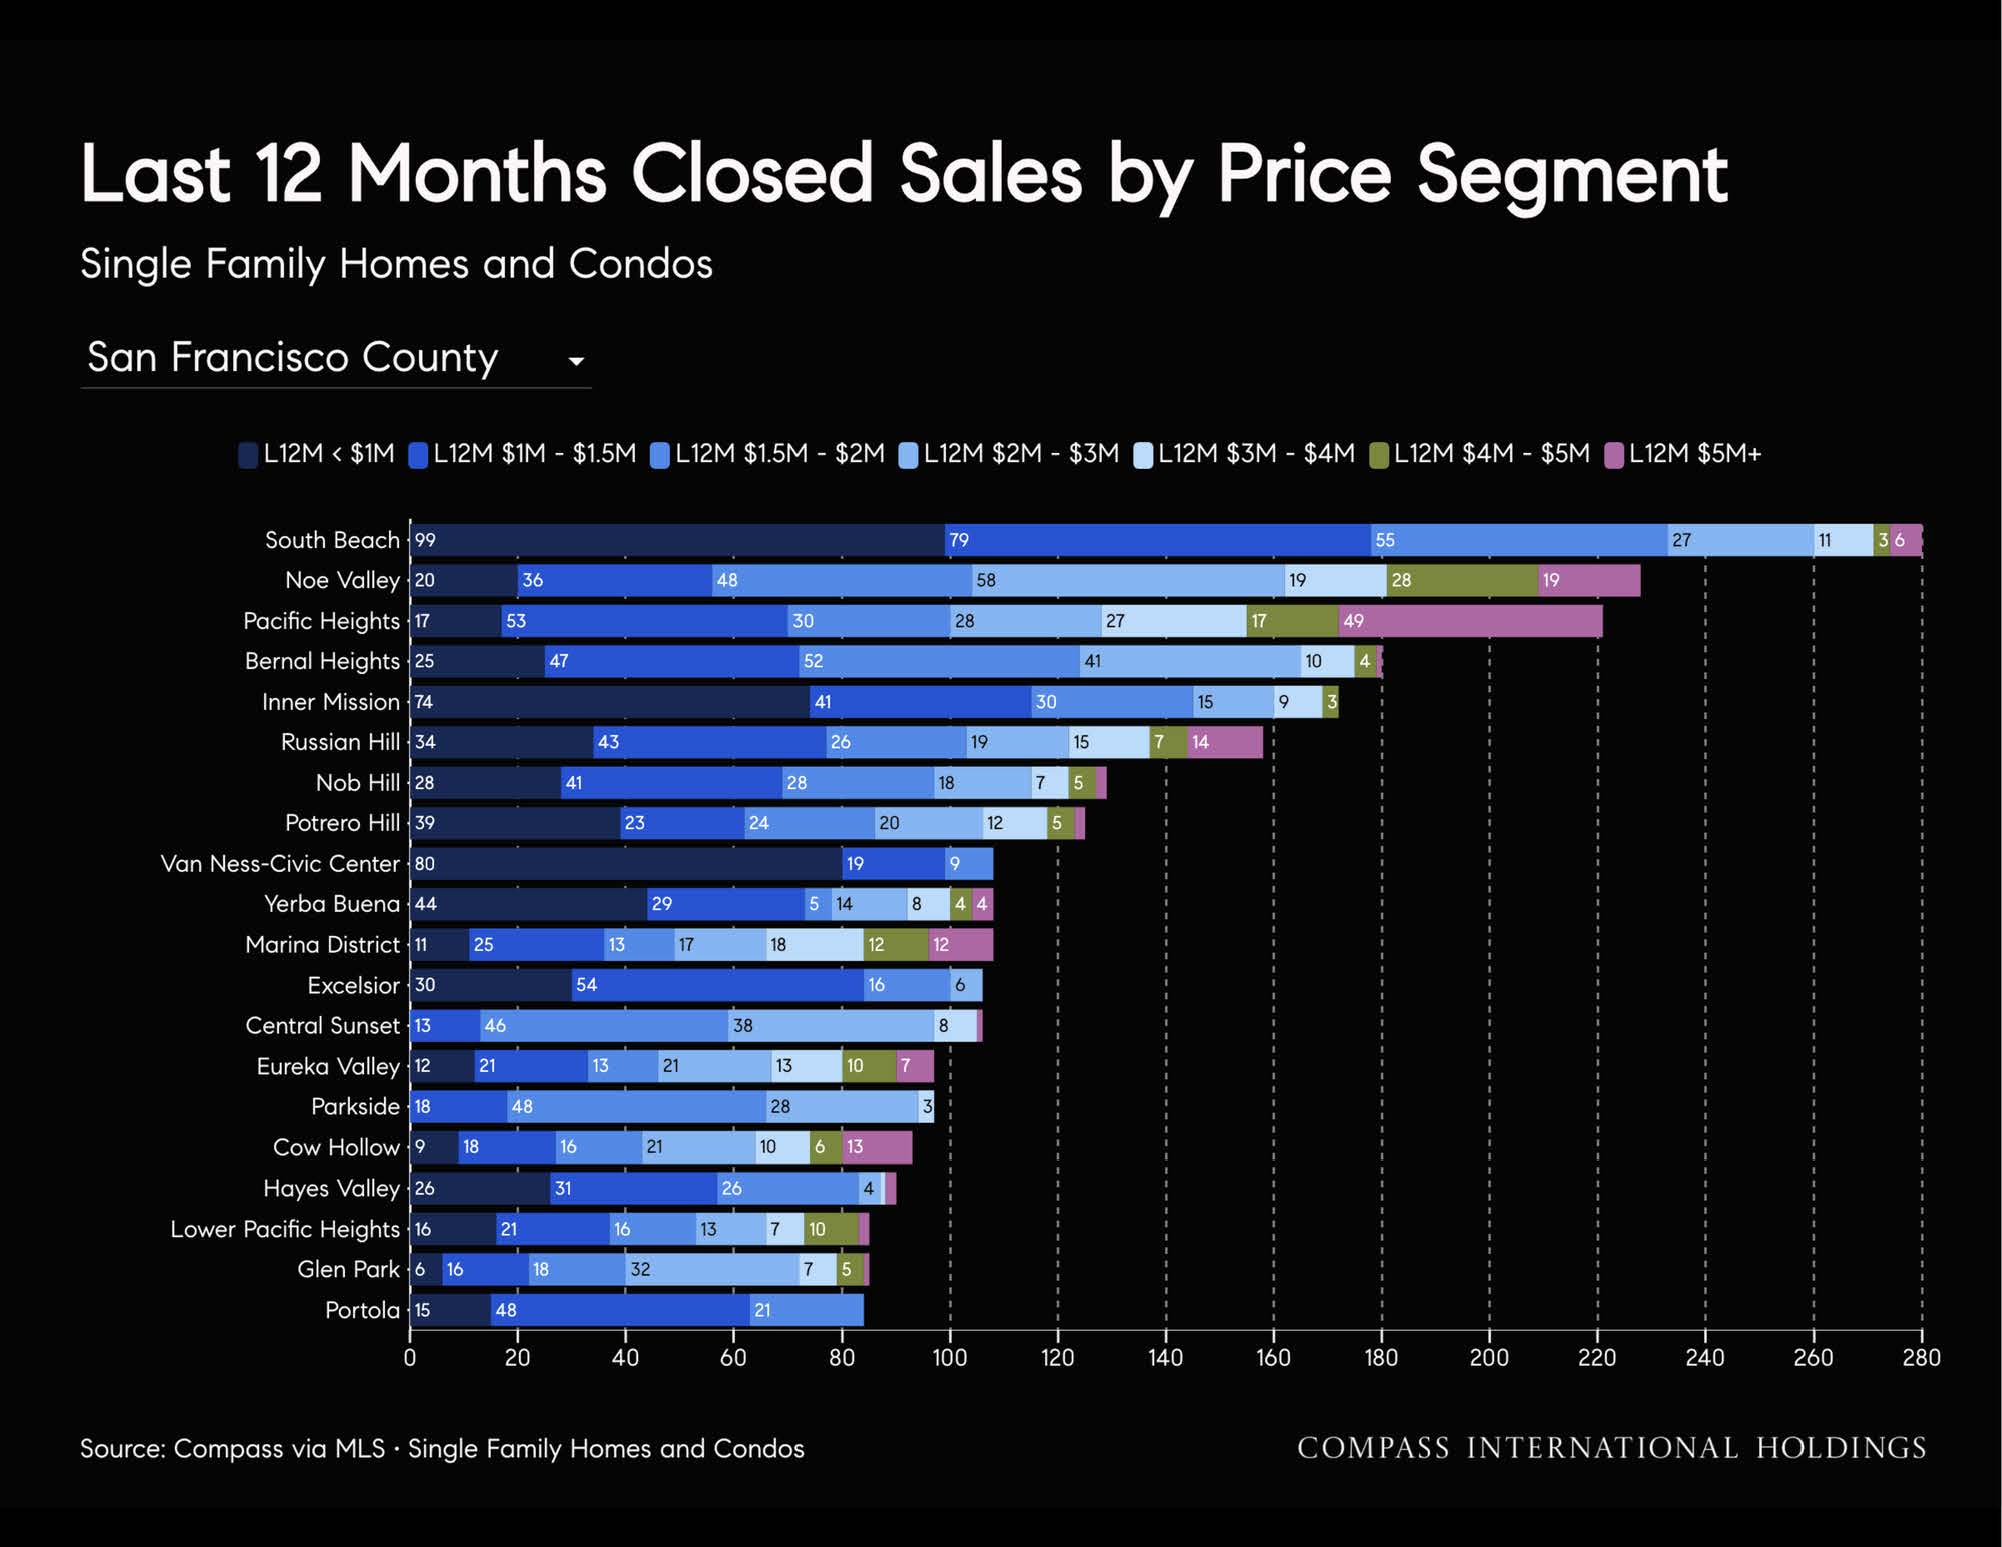
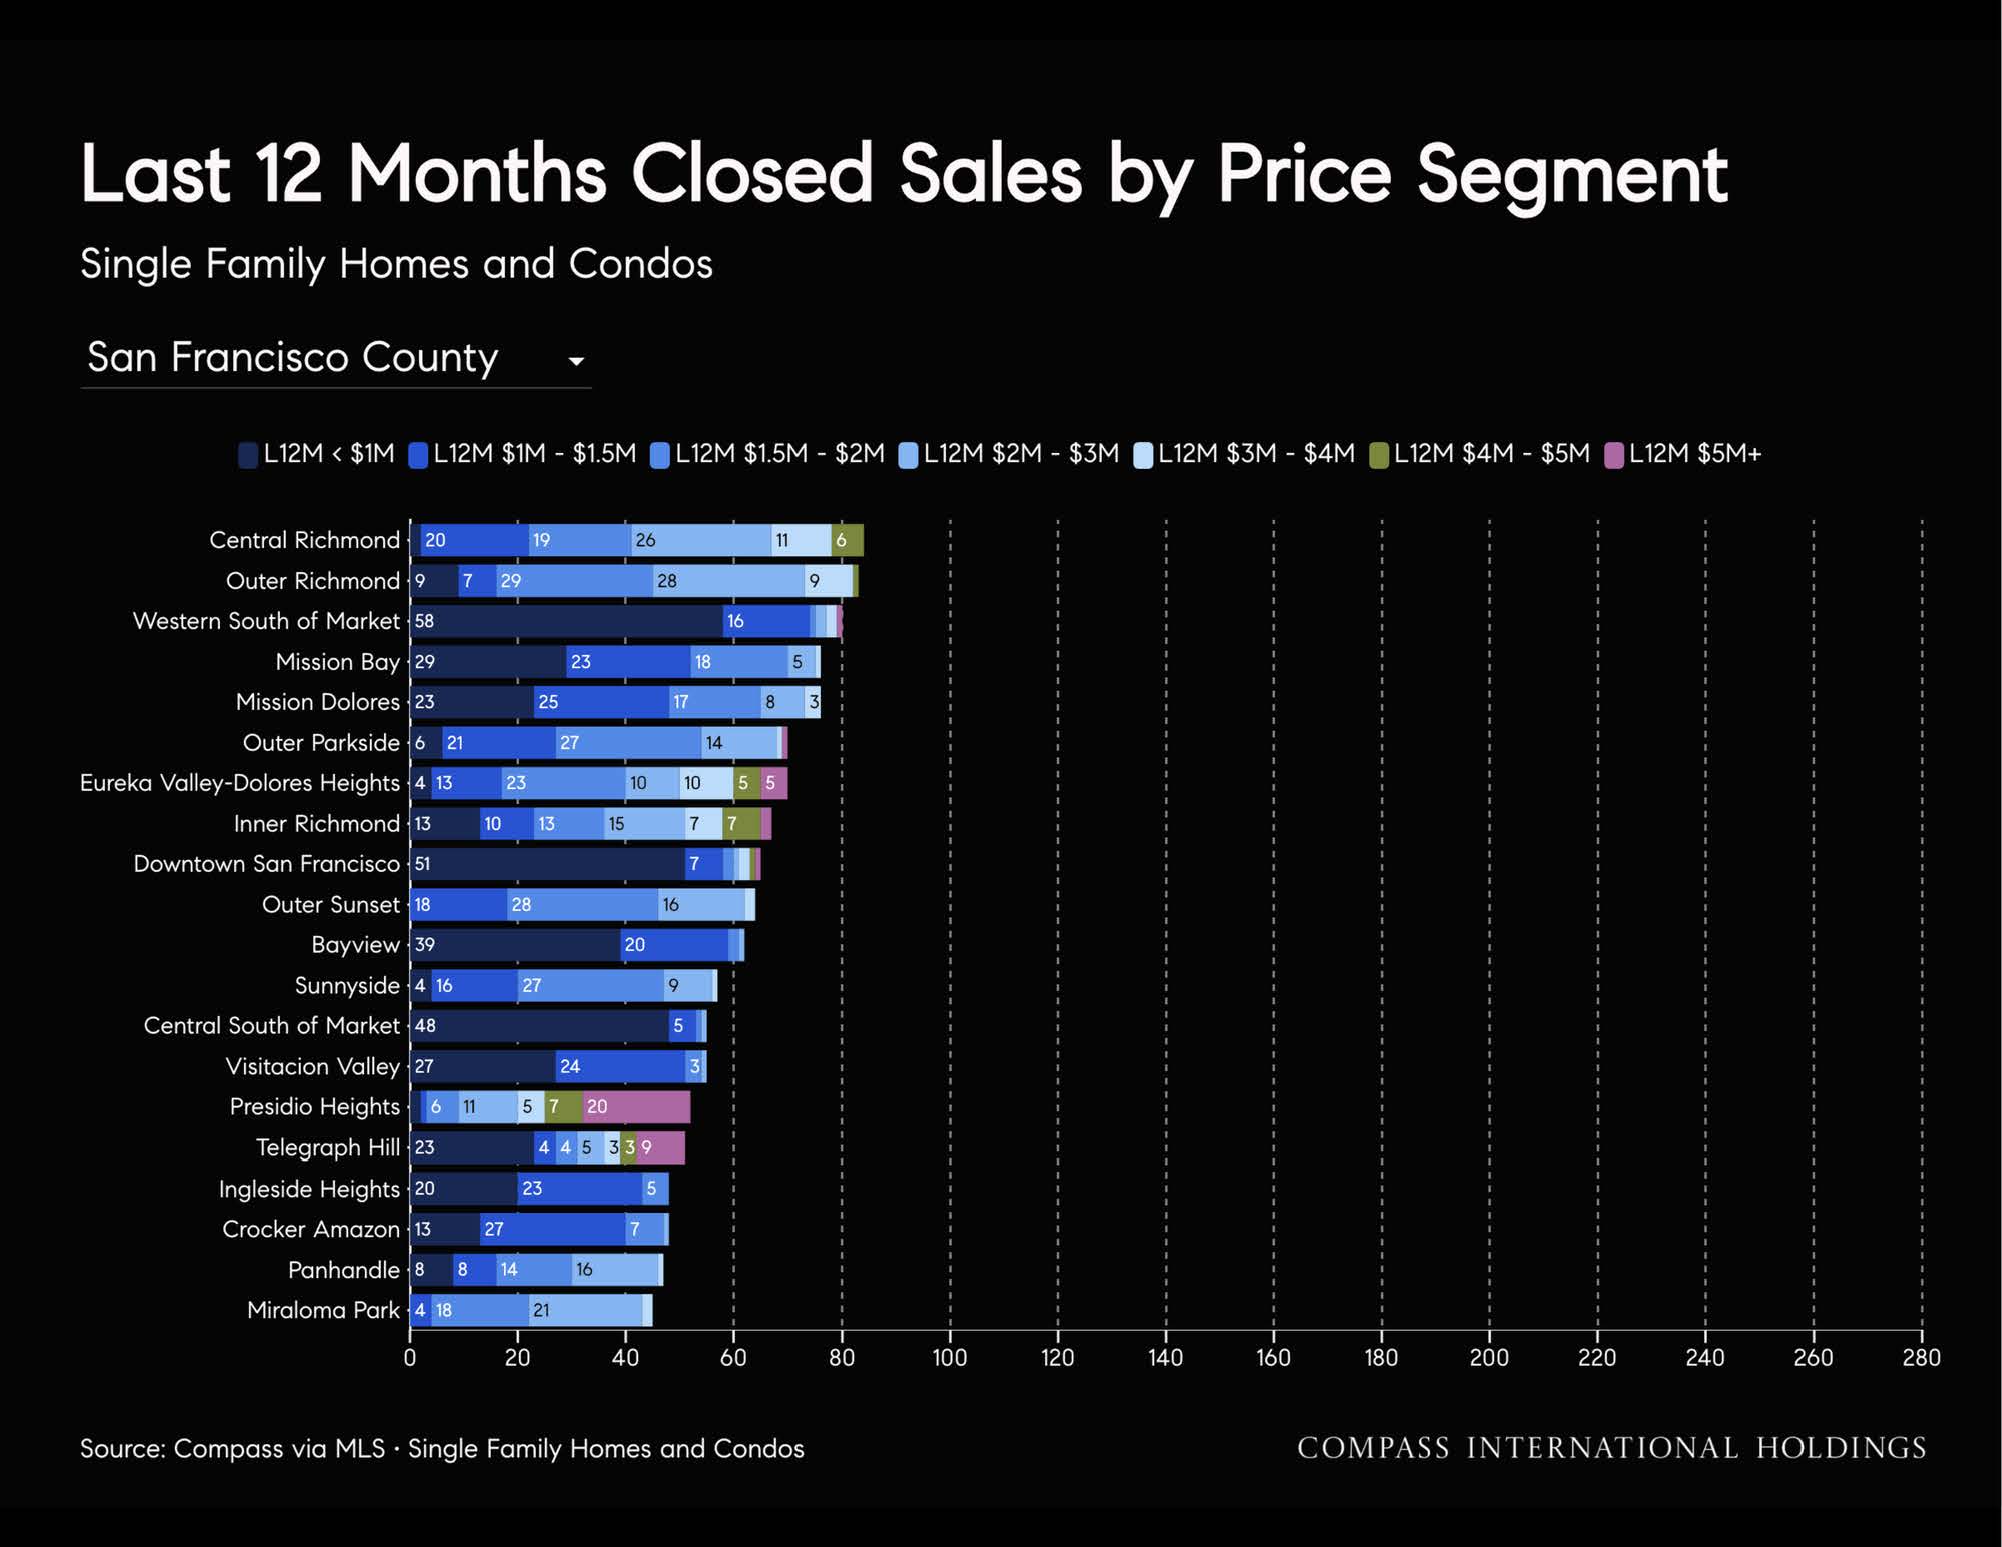
Sold listings are -7%
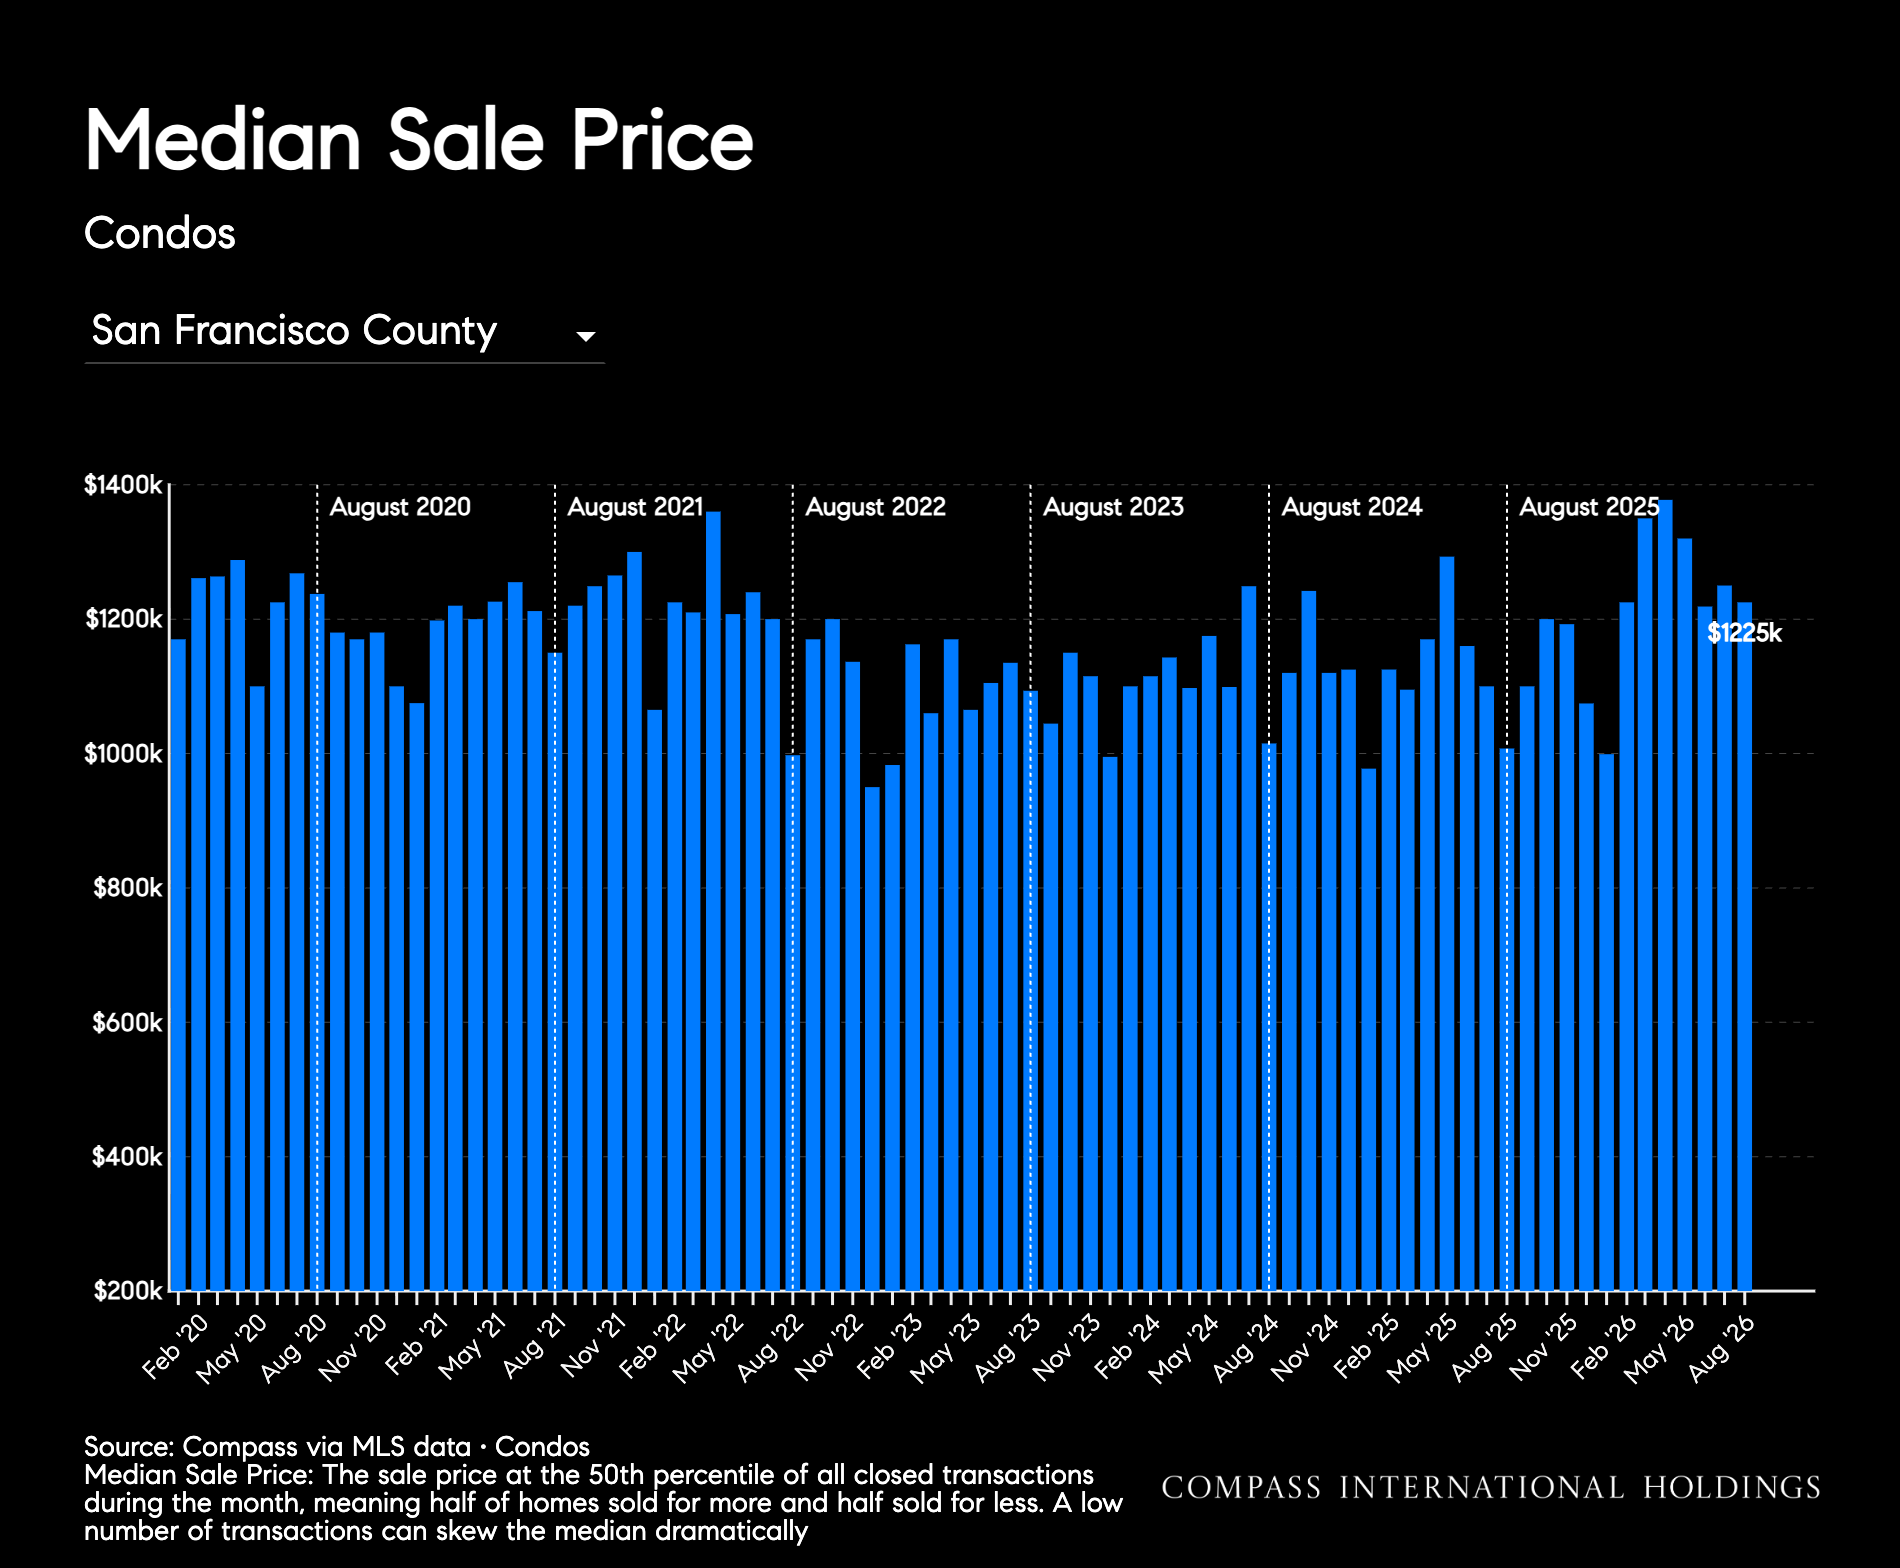
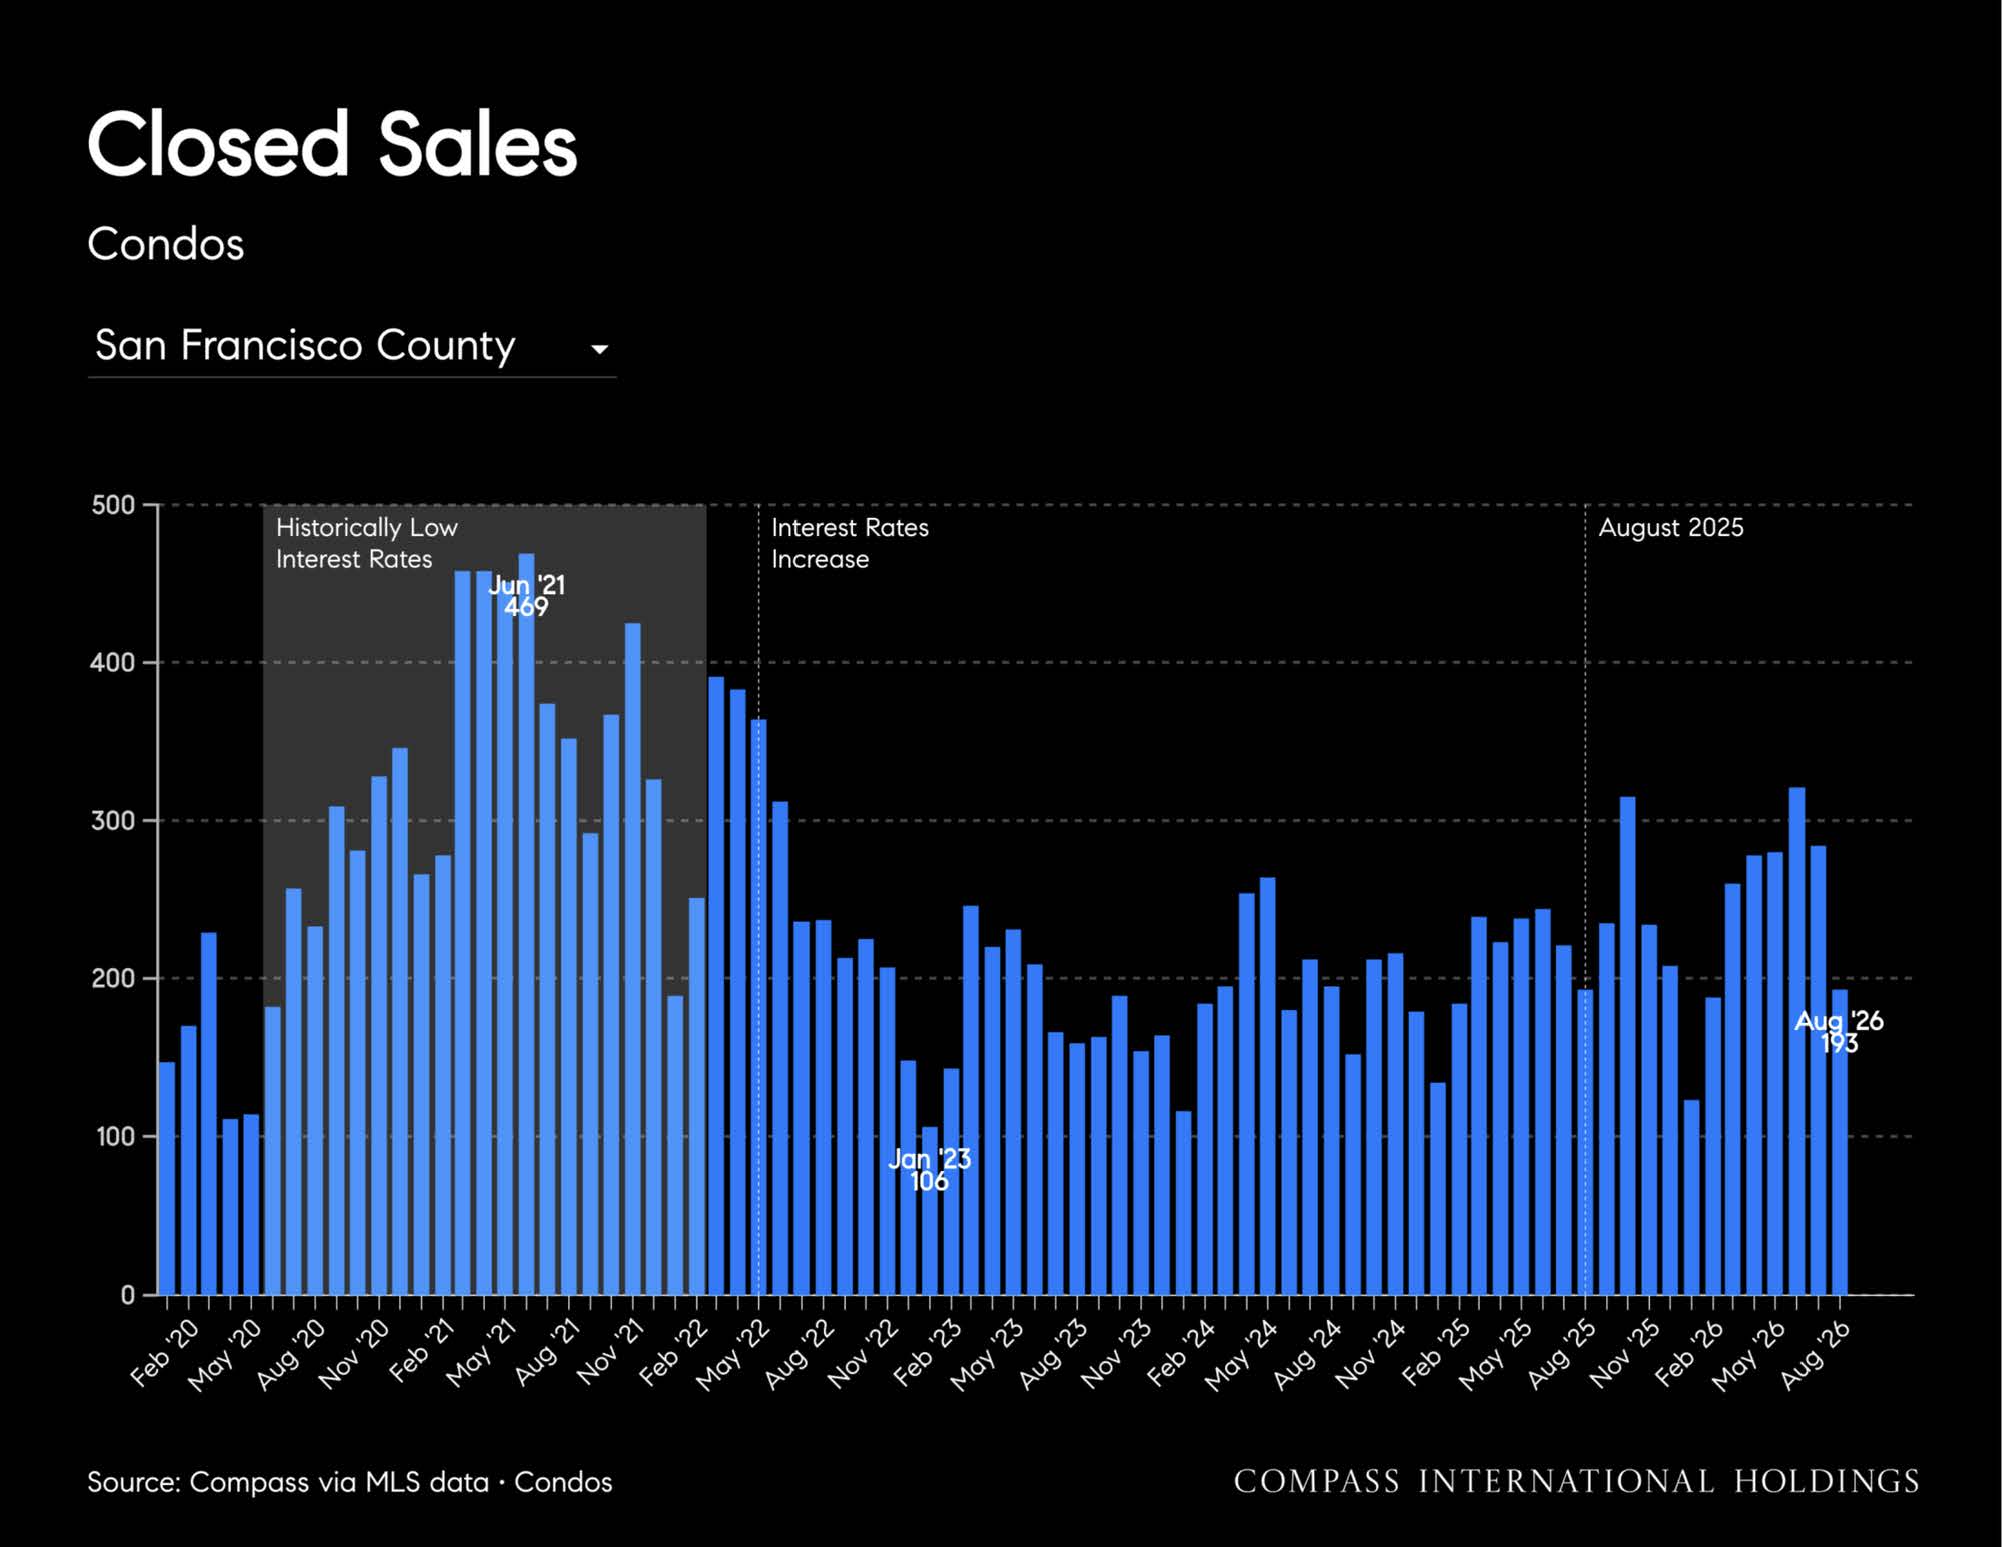
Condos
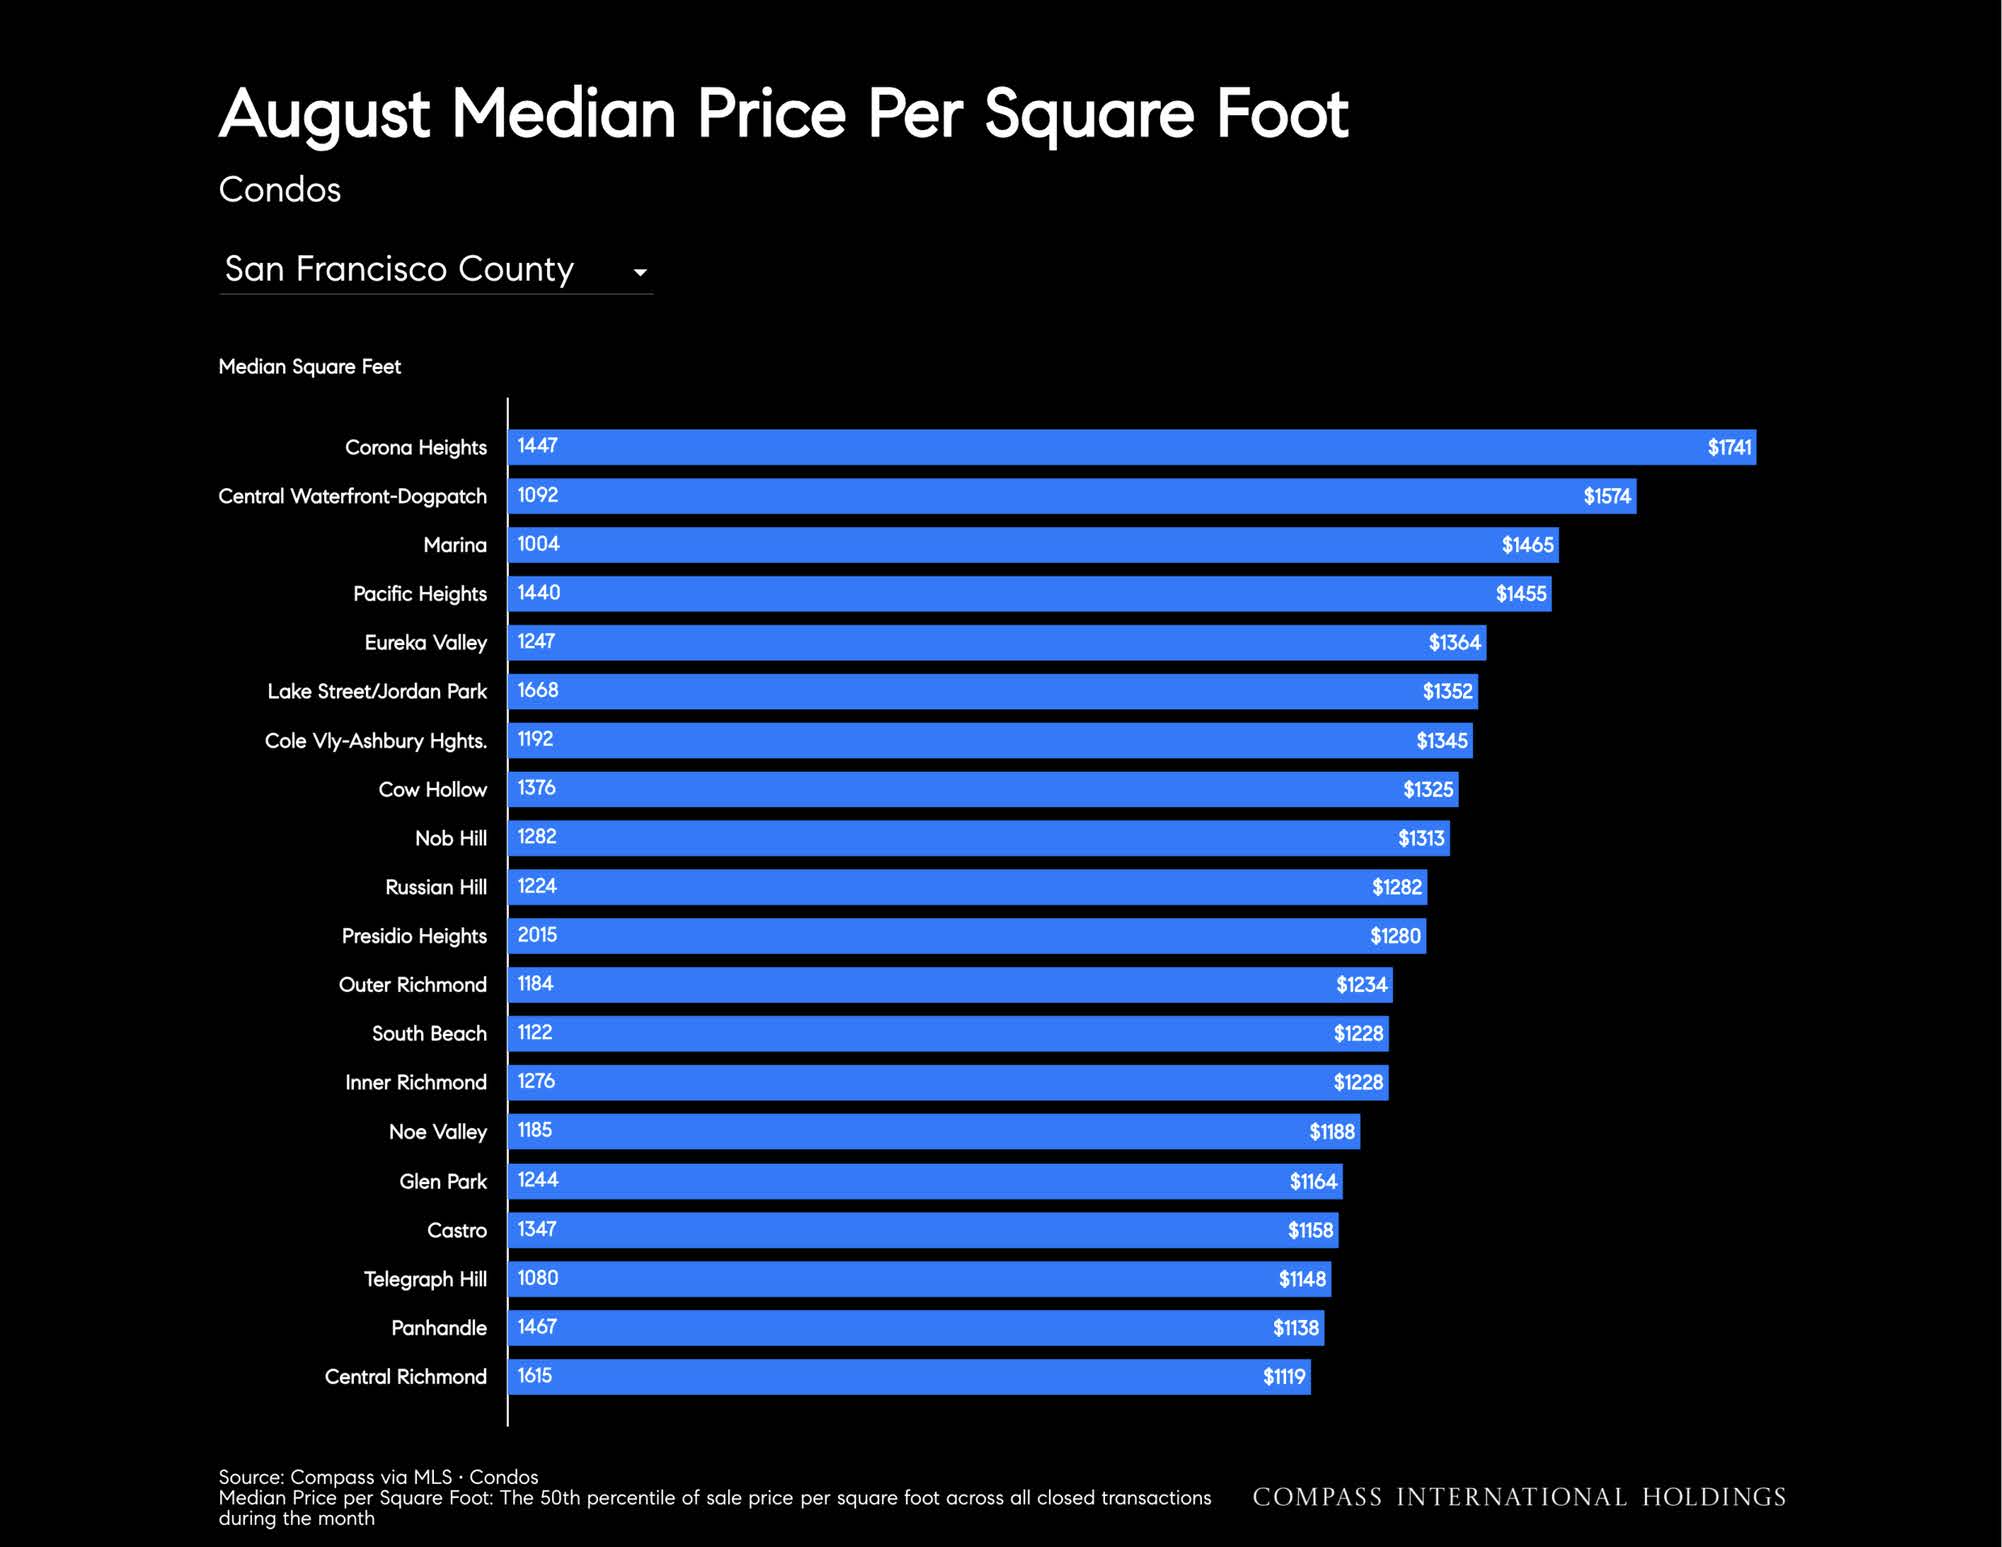
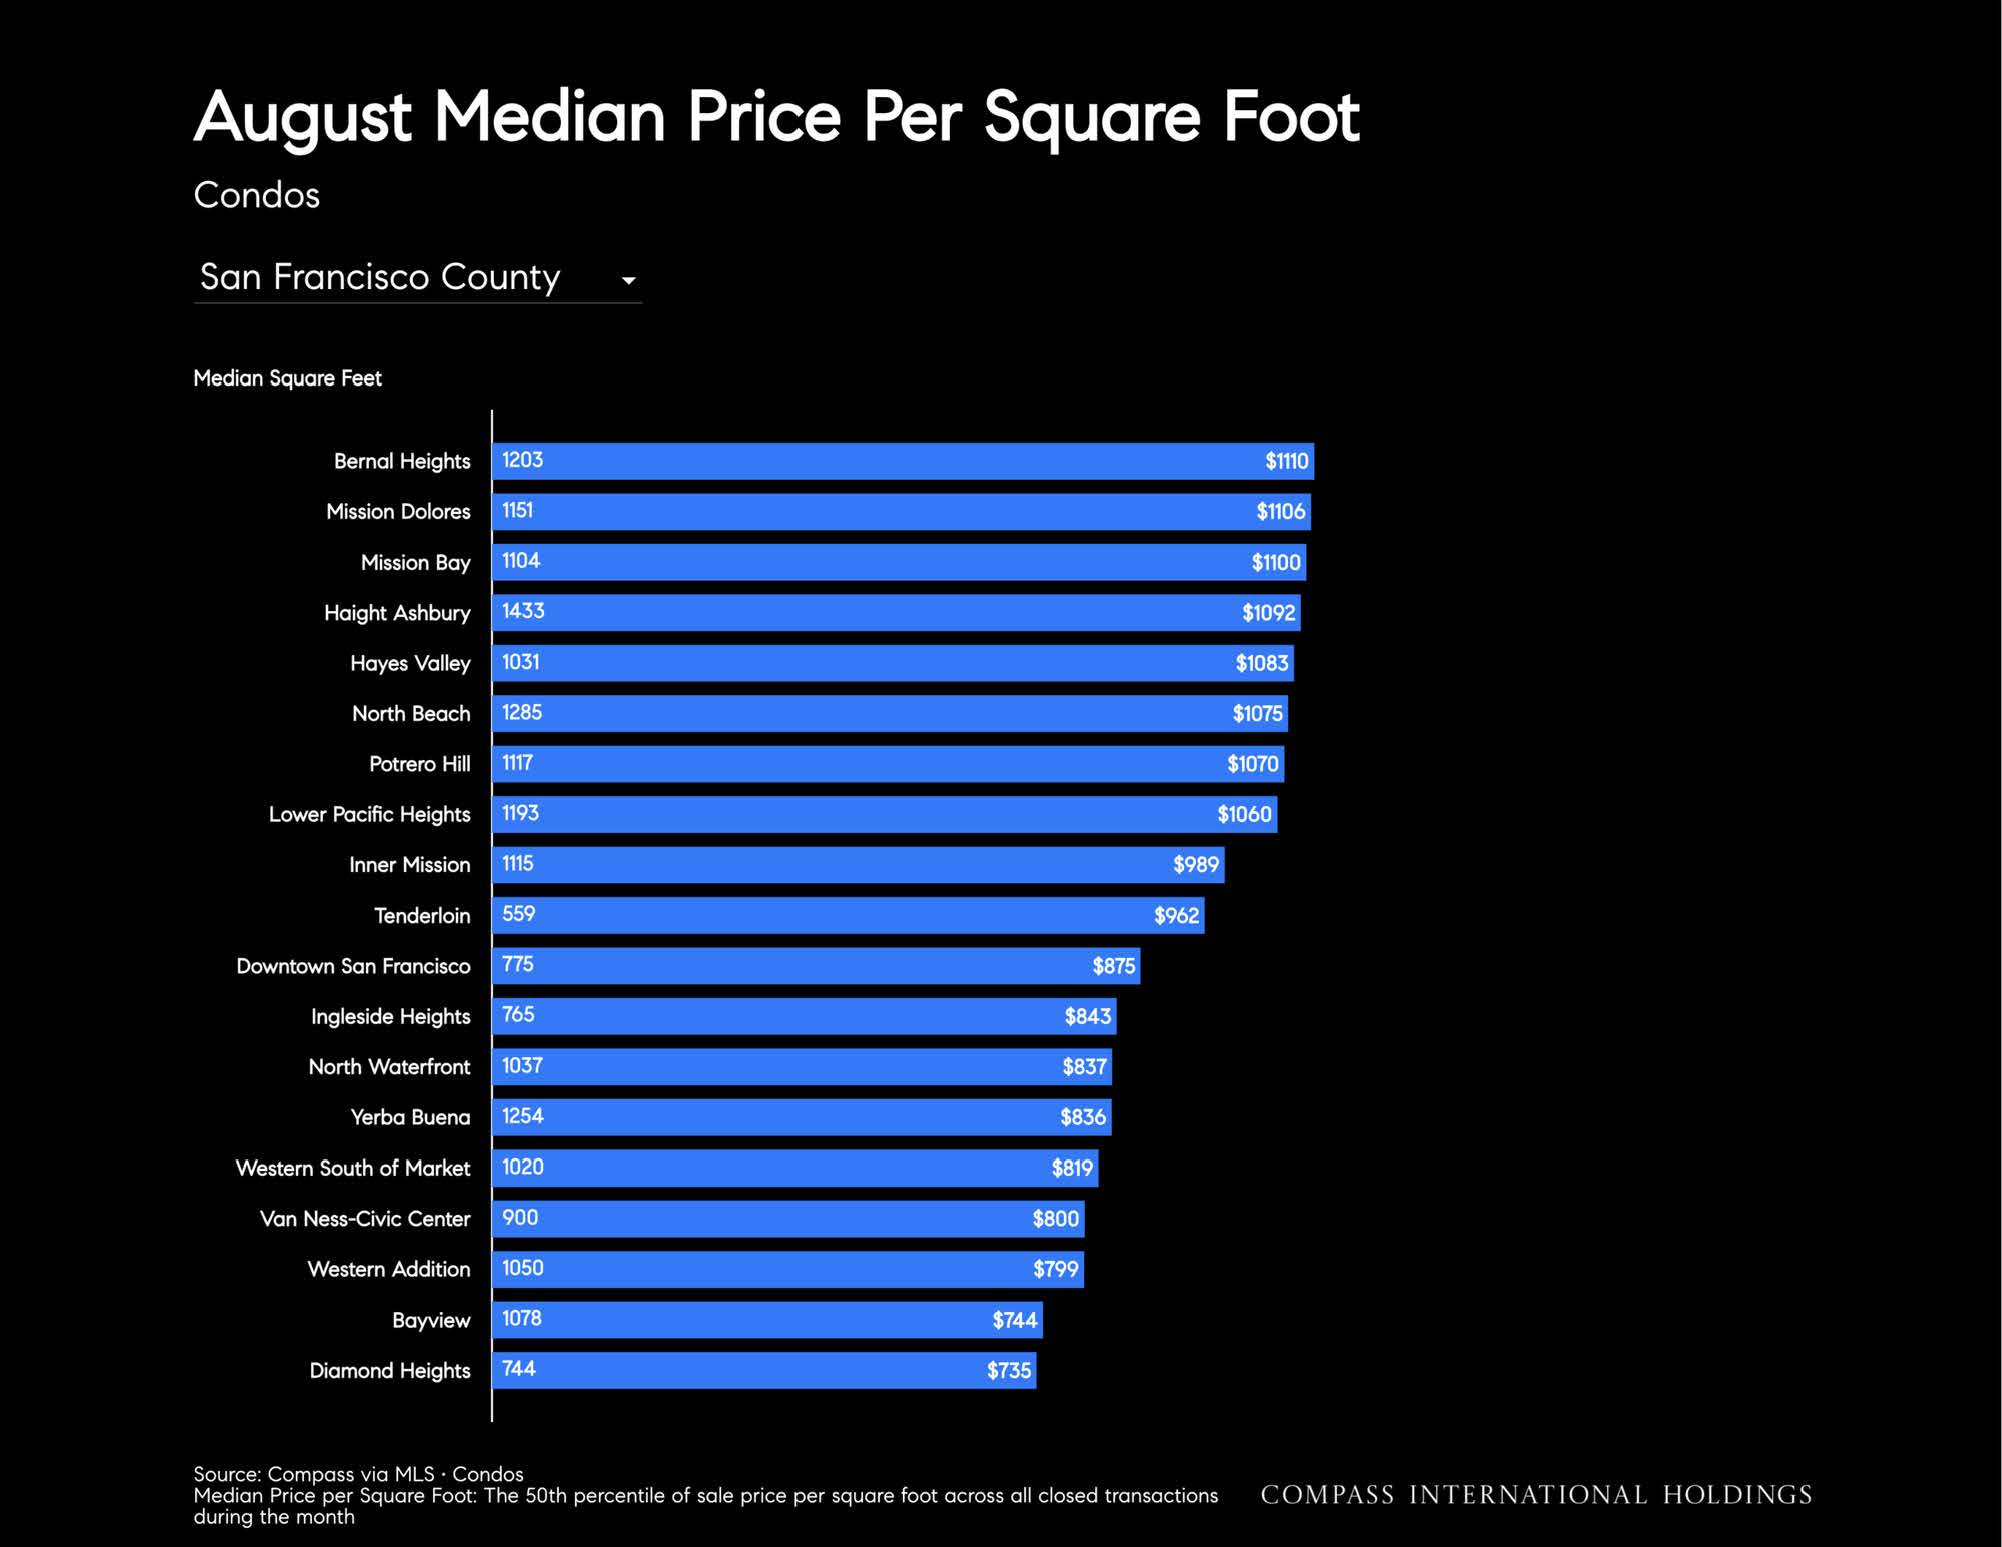
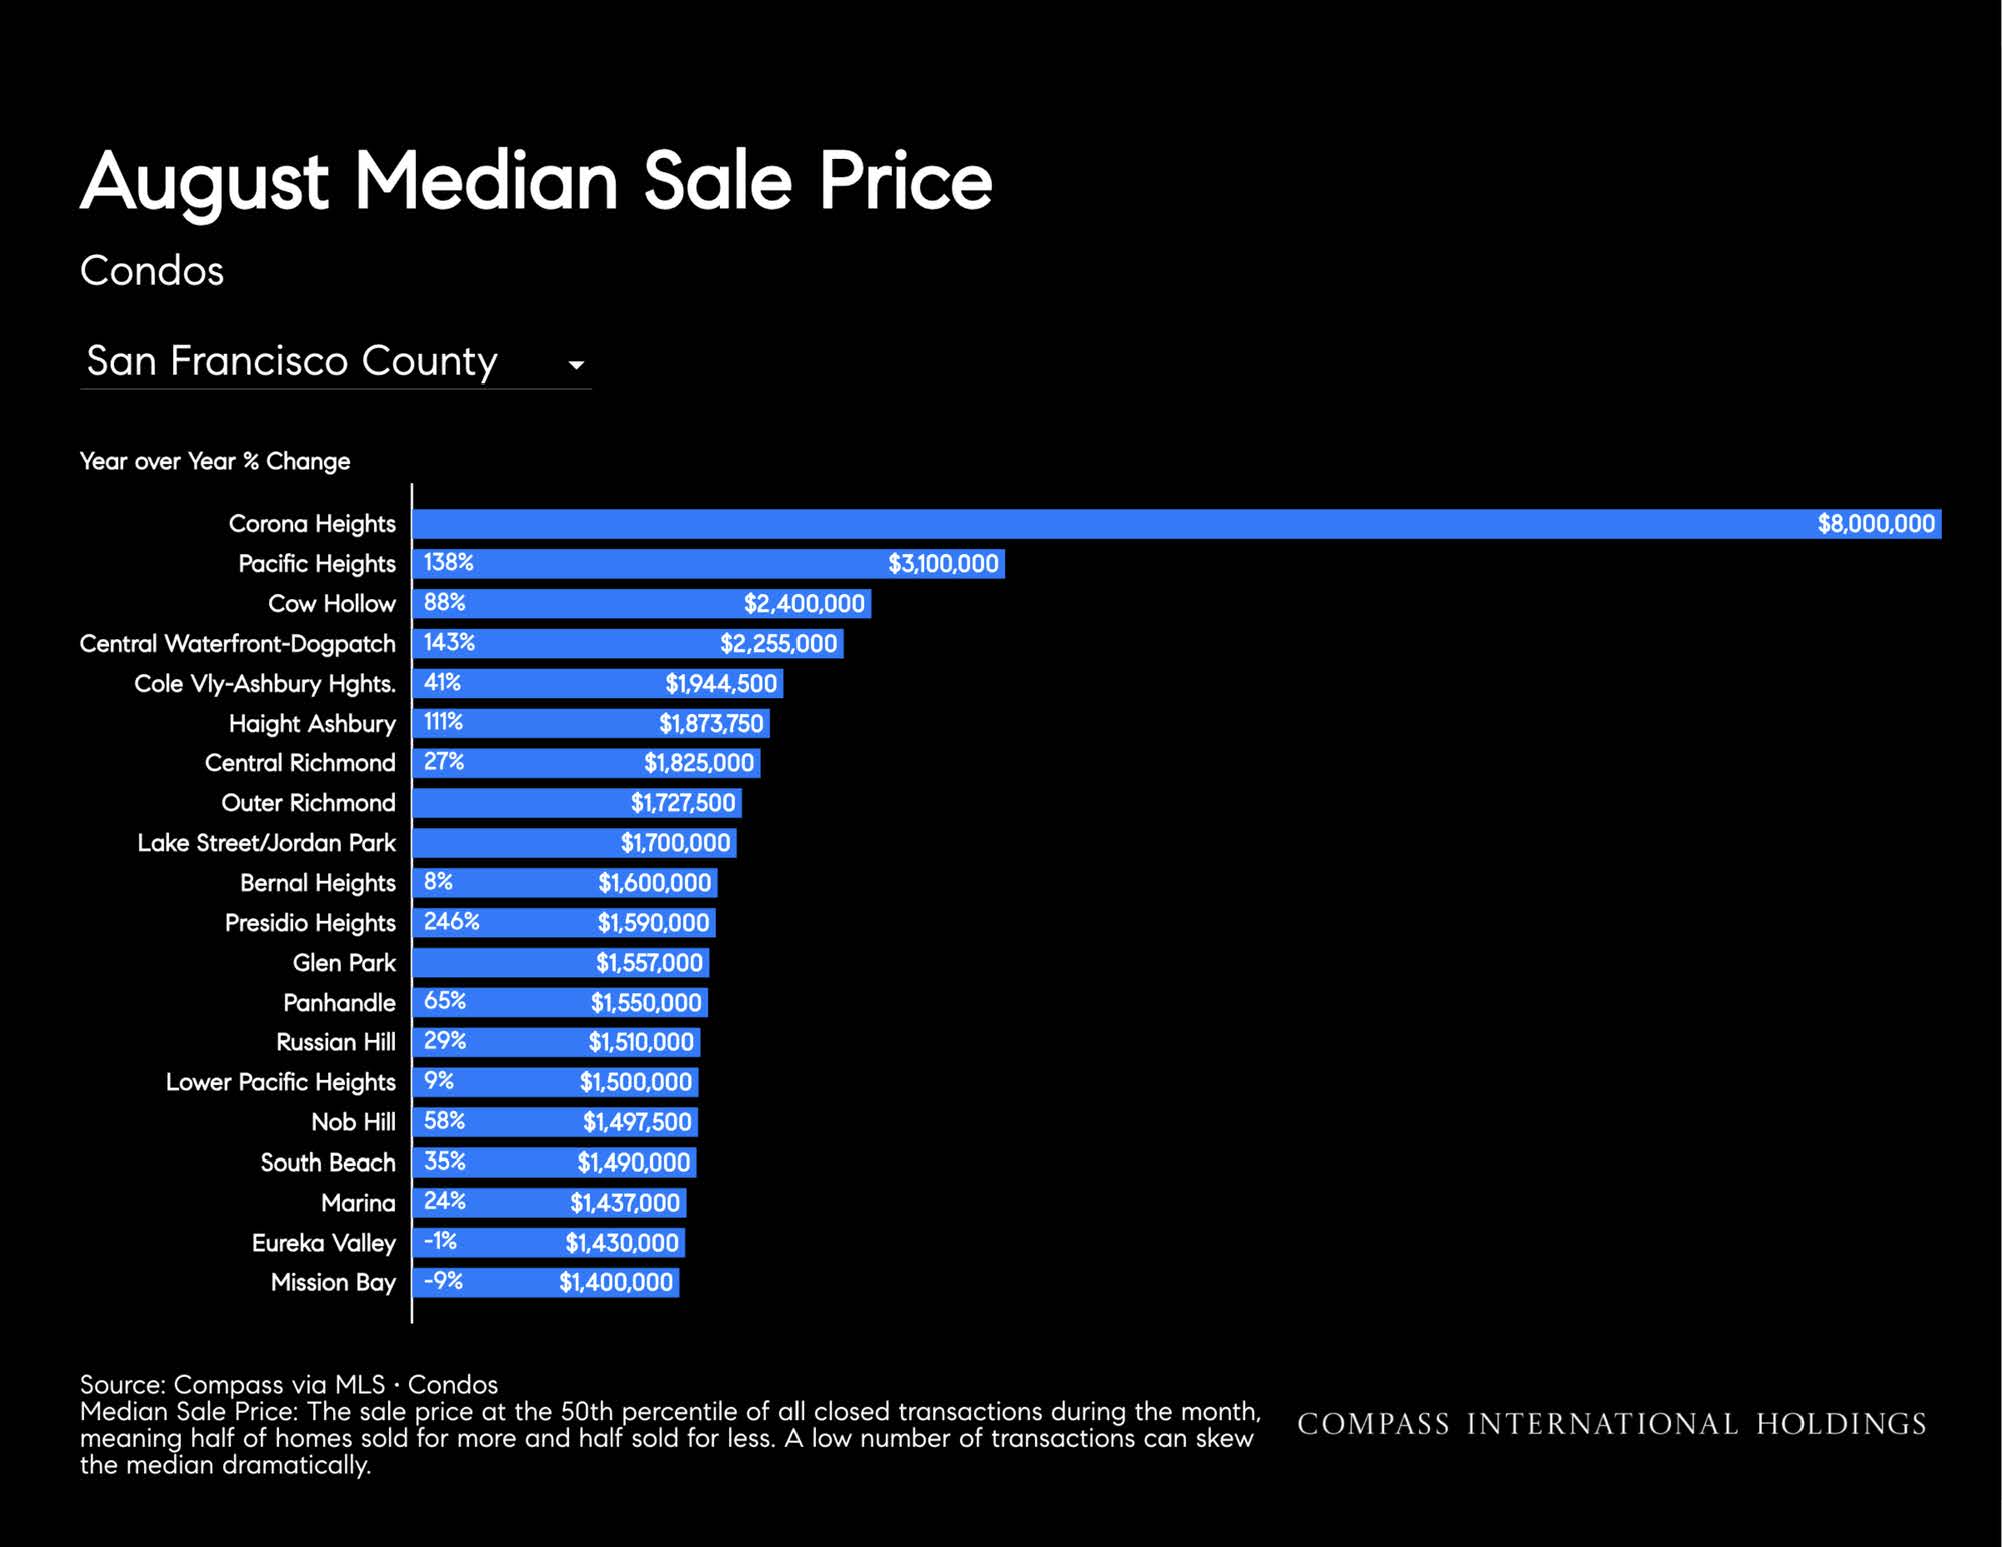
Median price is +23% ($1,257,500)
Days on Market are -63% to 19
Active listings are -33%
Sold listings are +15%
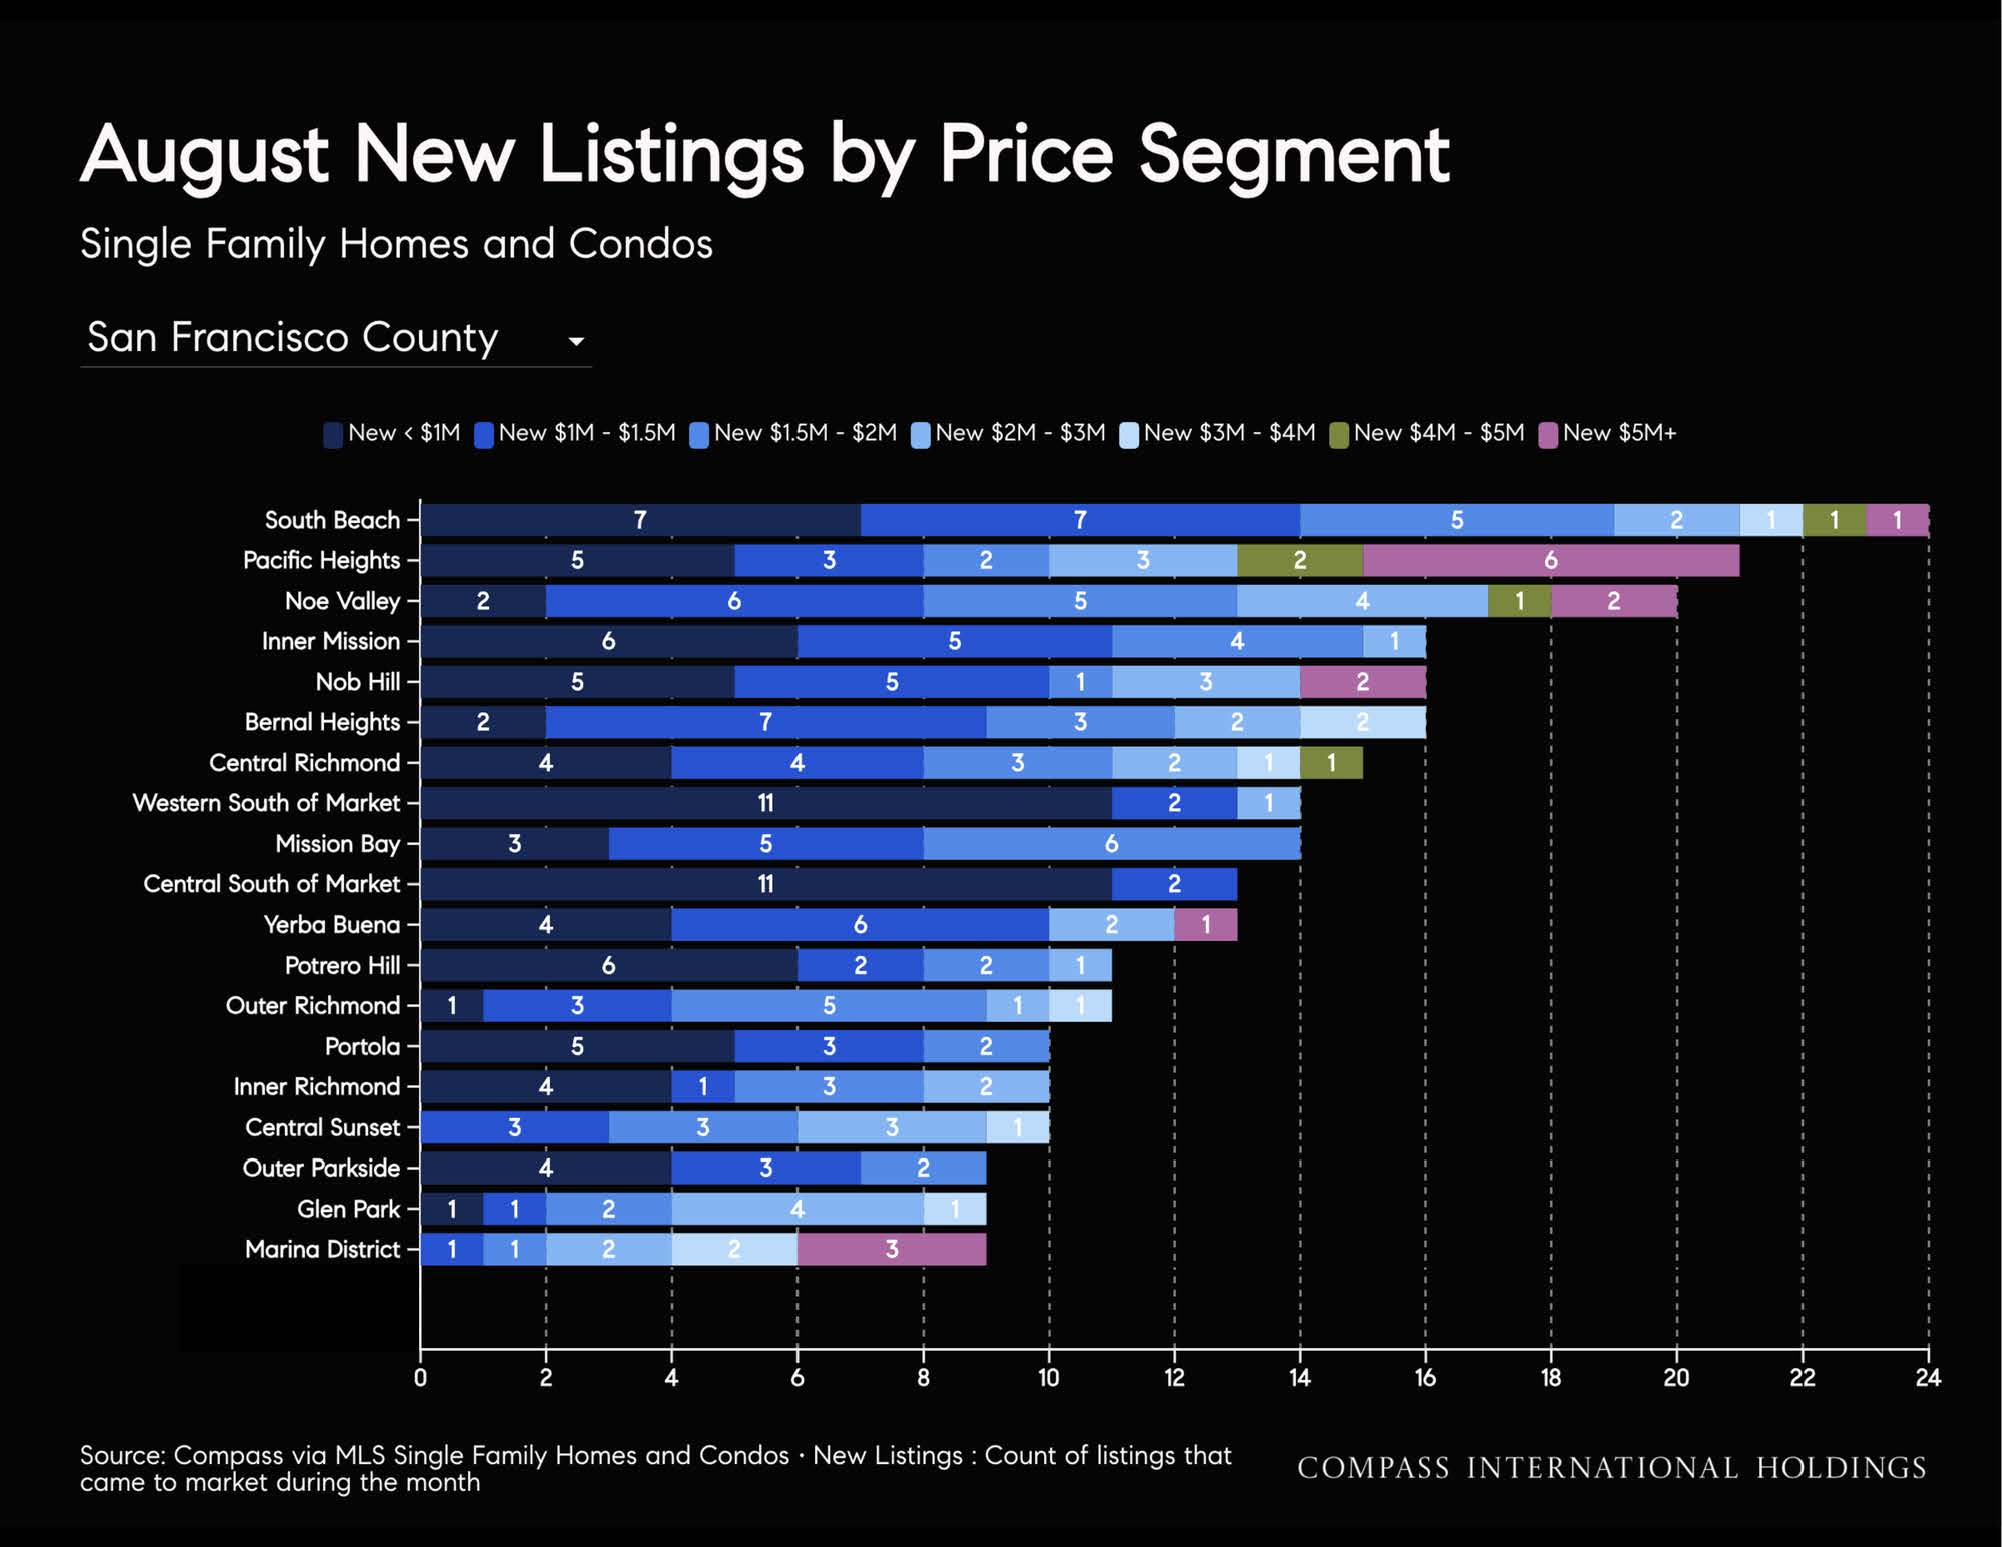
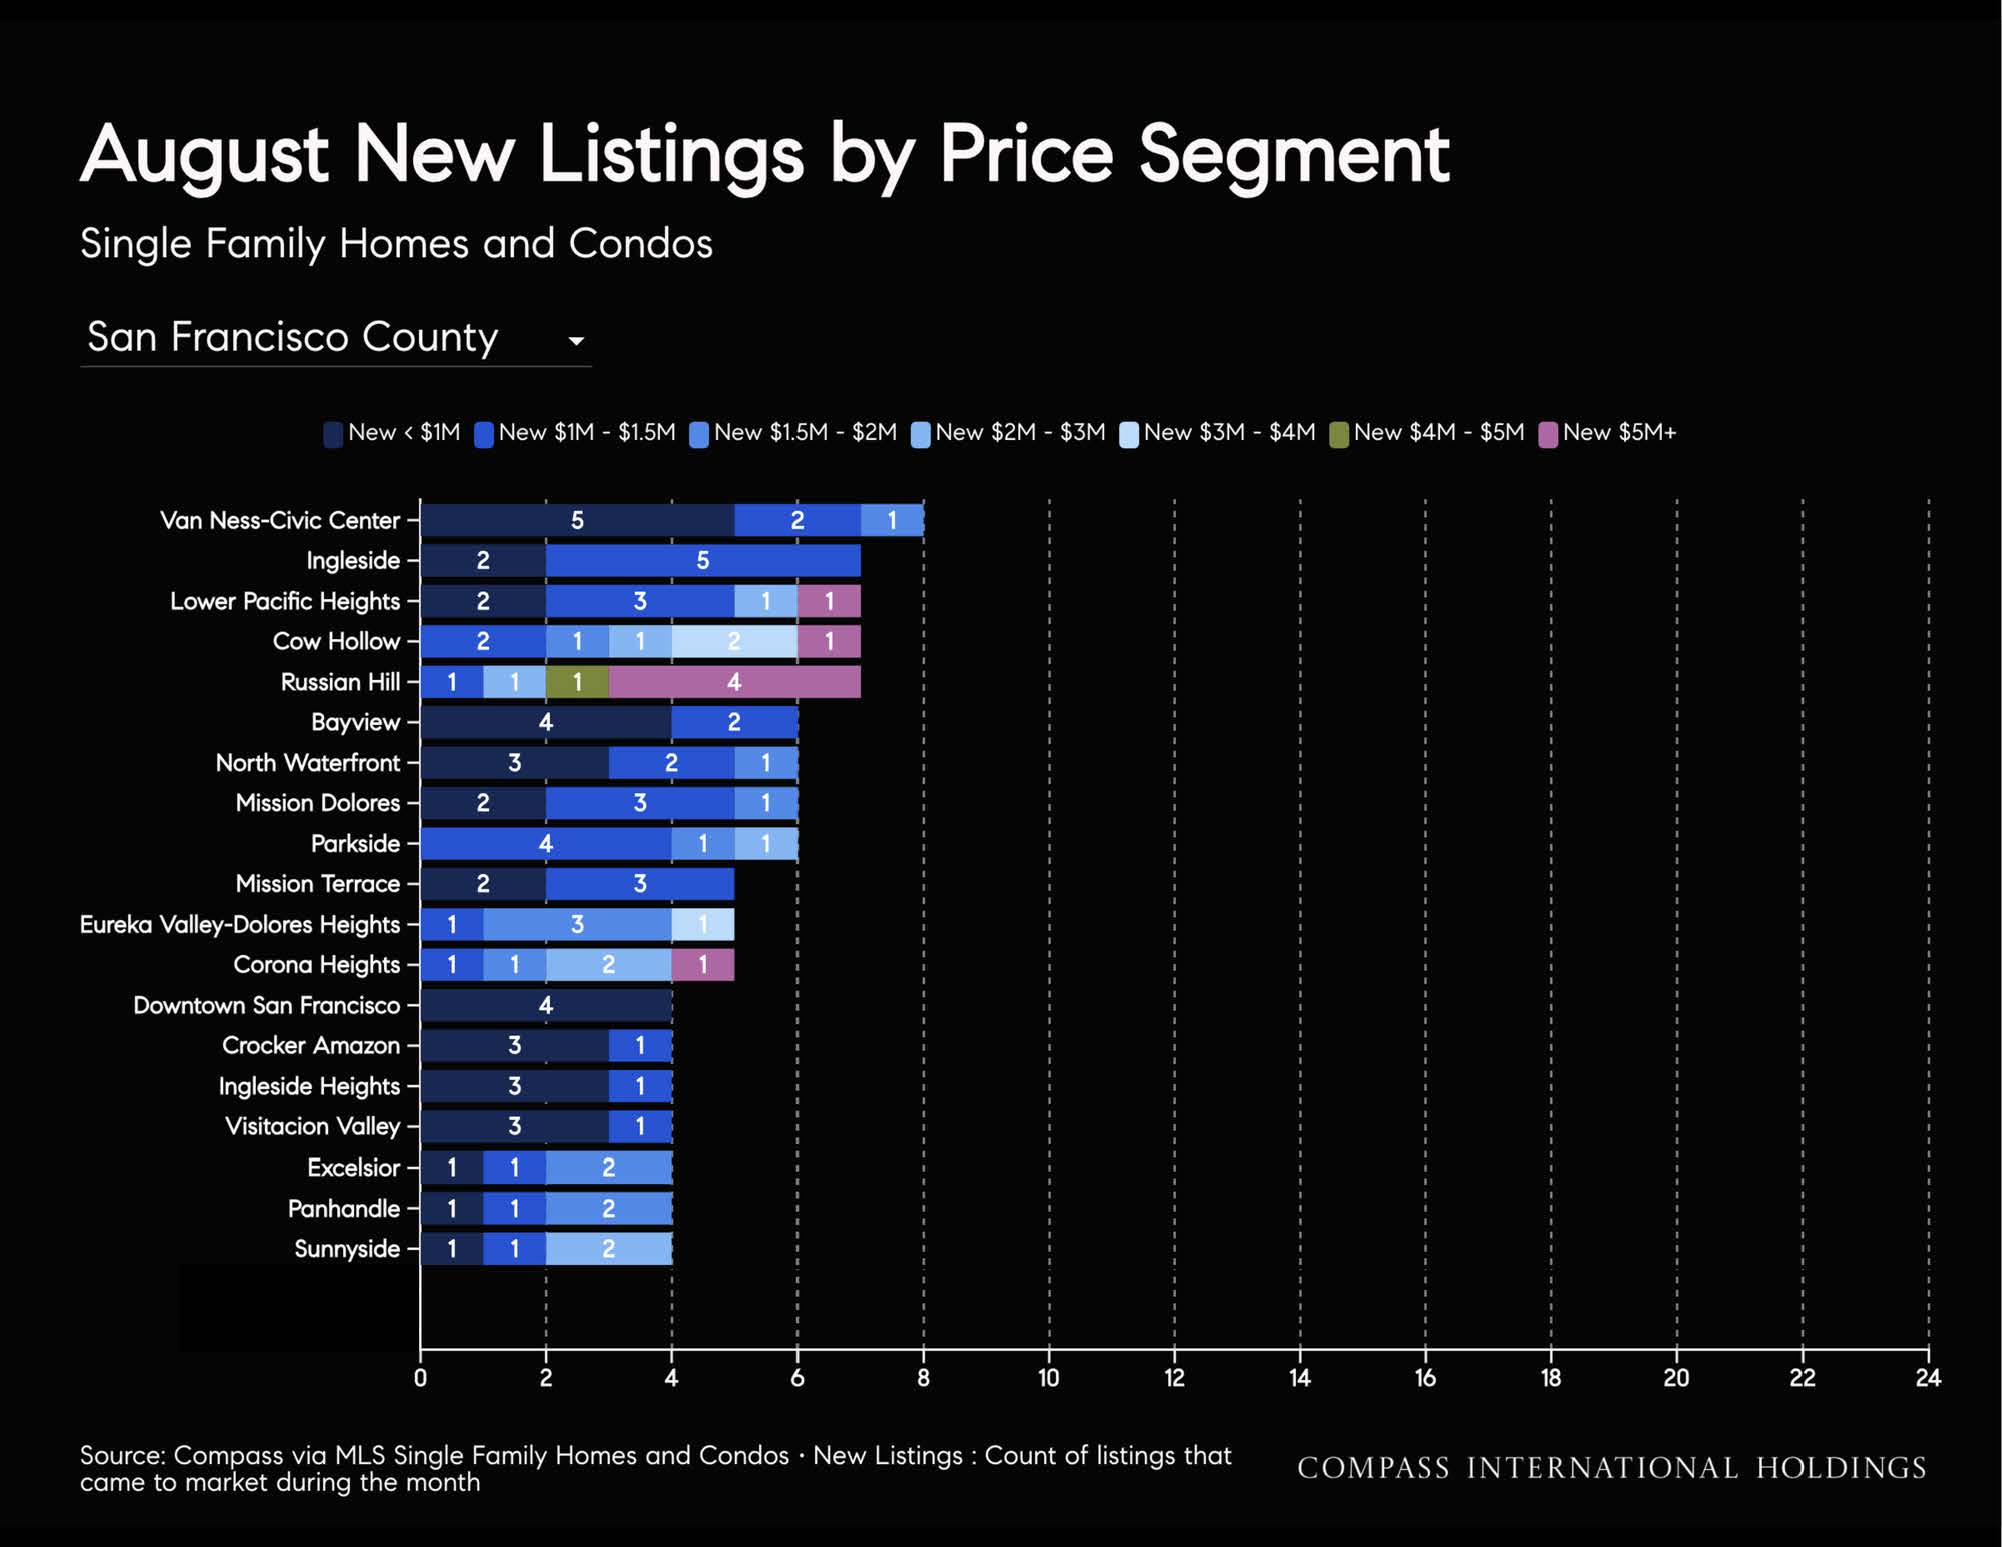
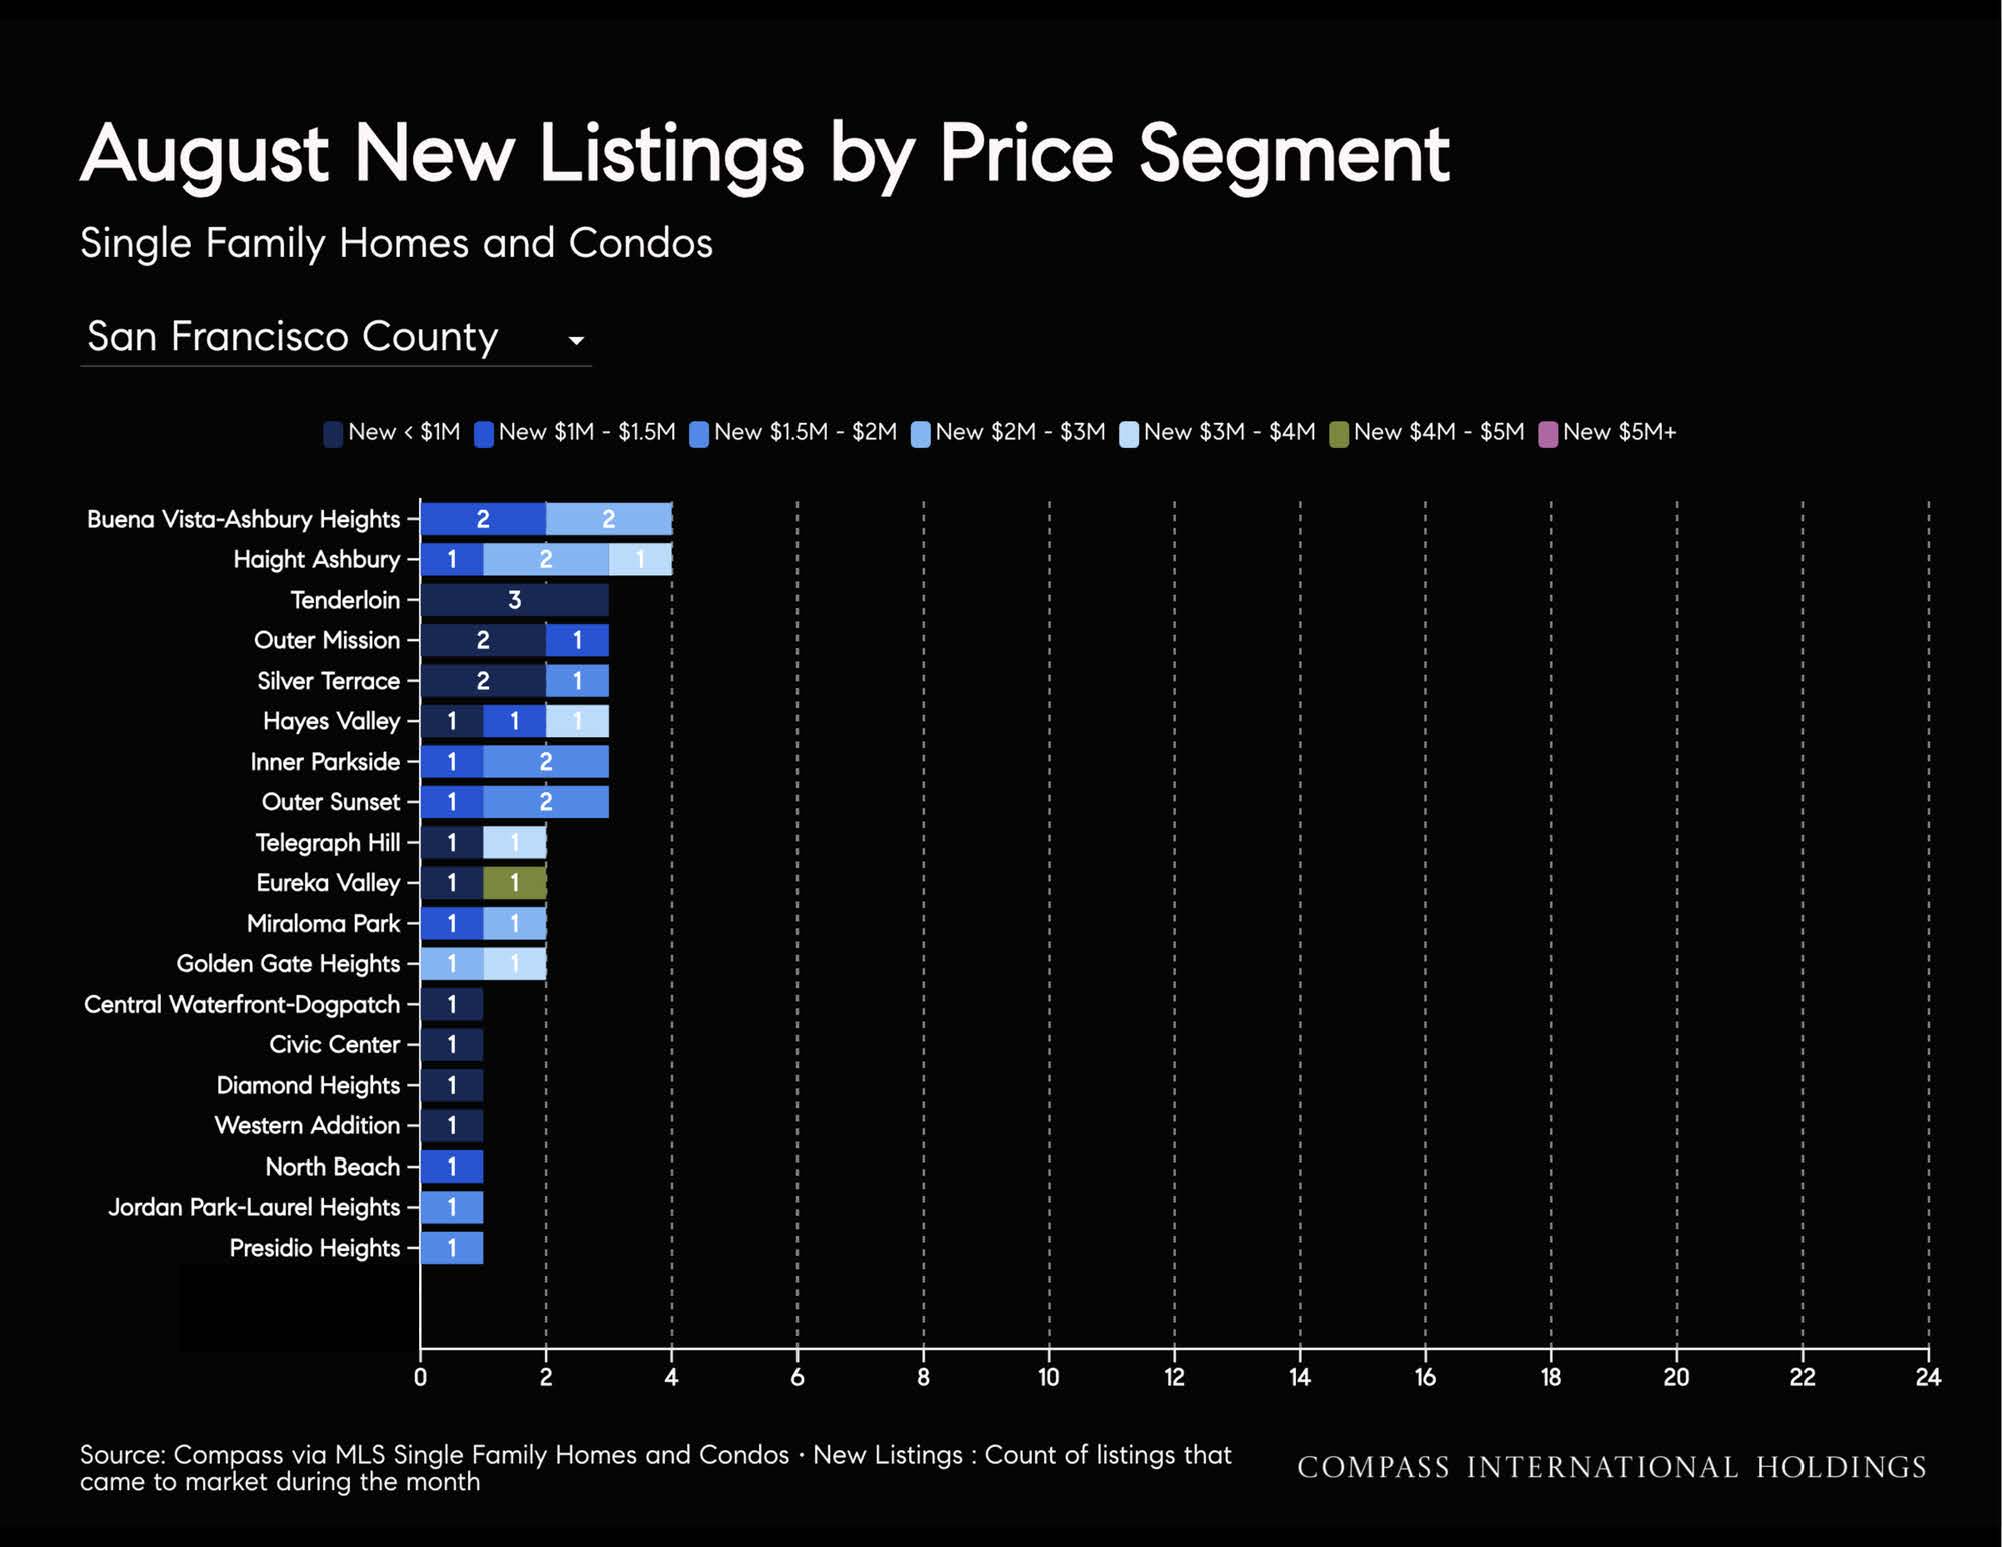
More details and charts below
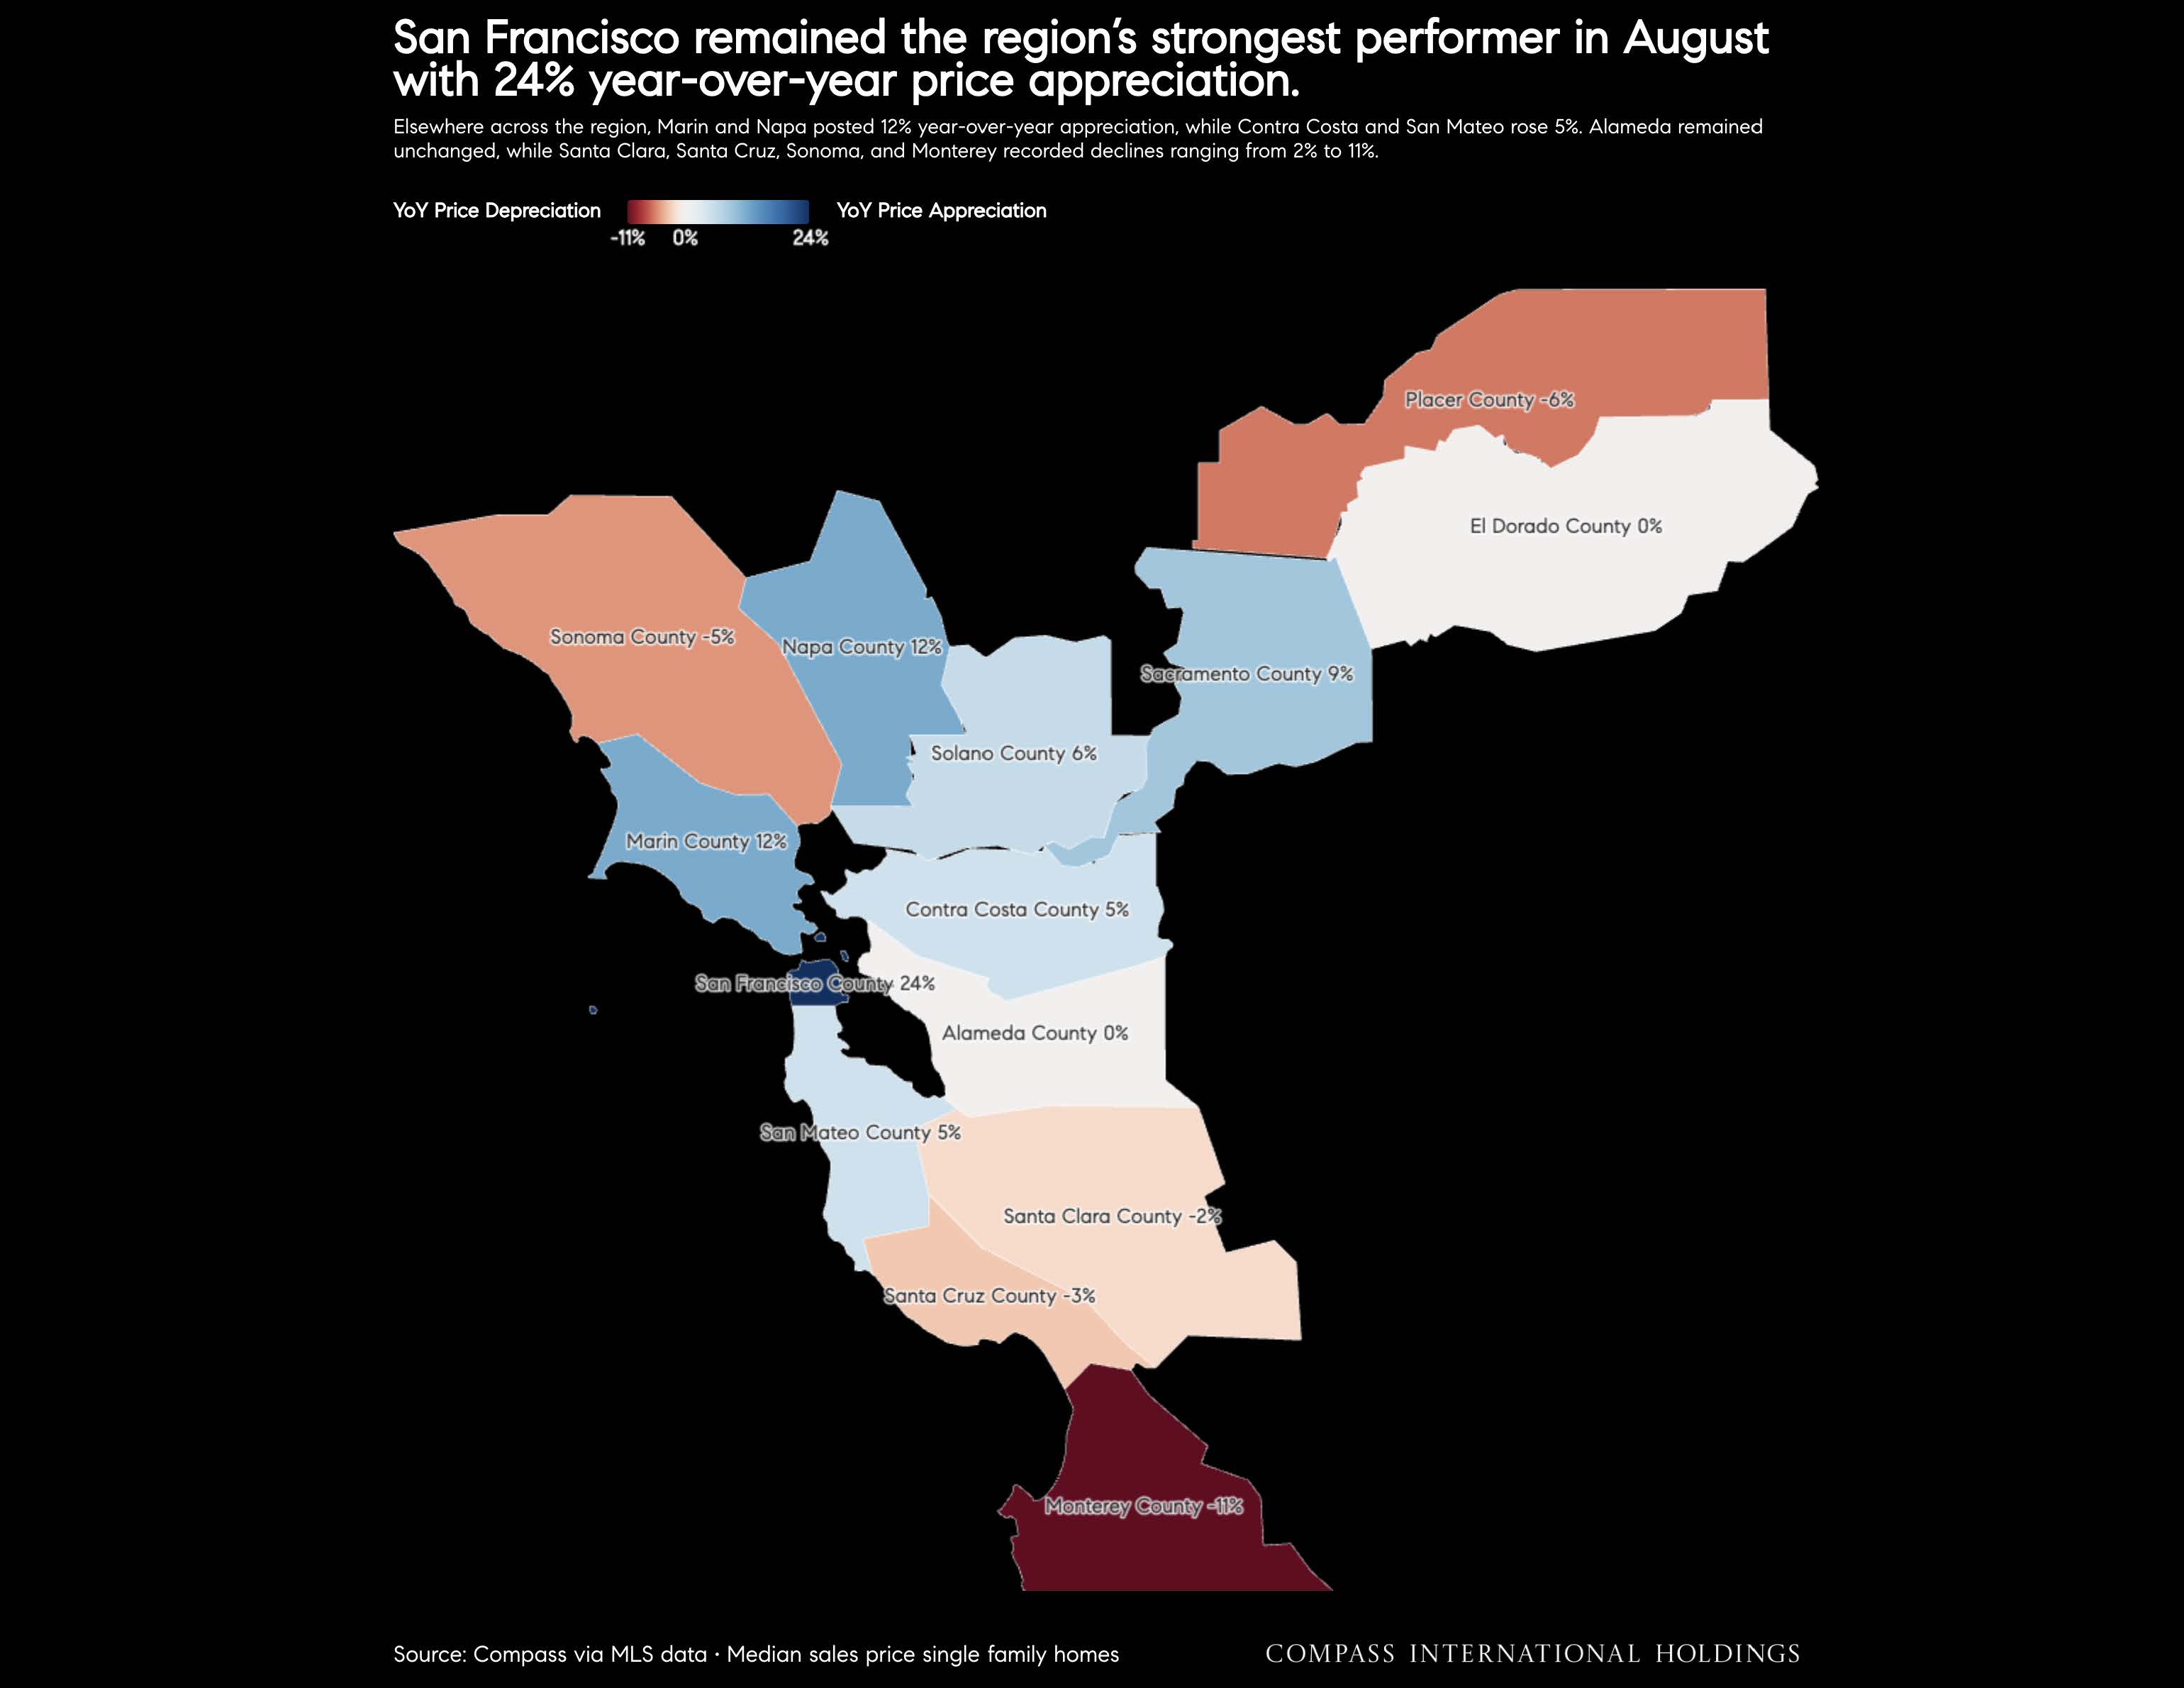
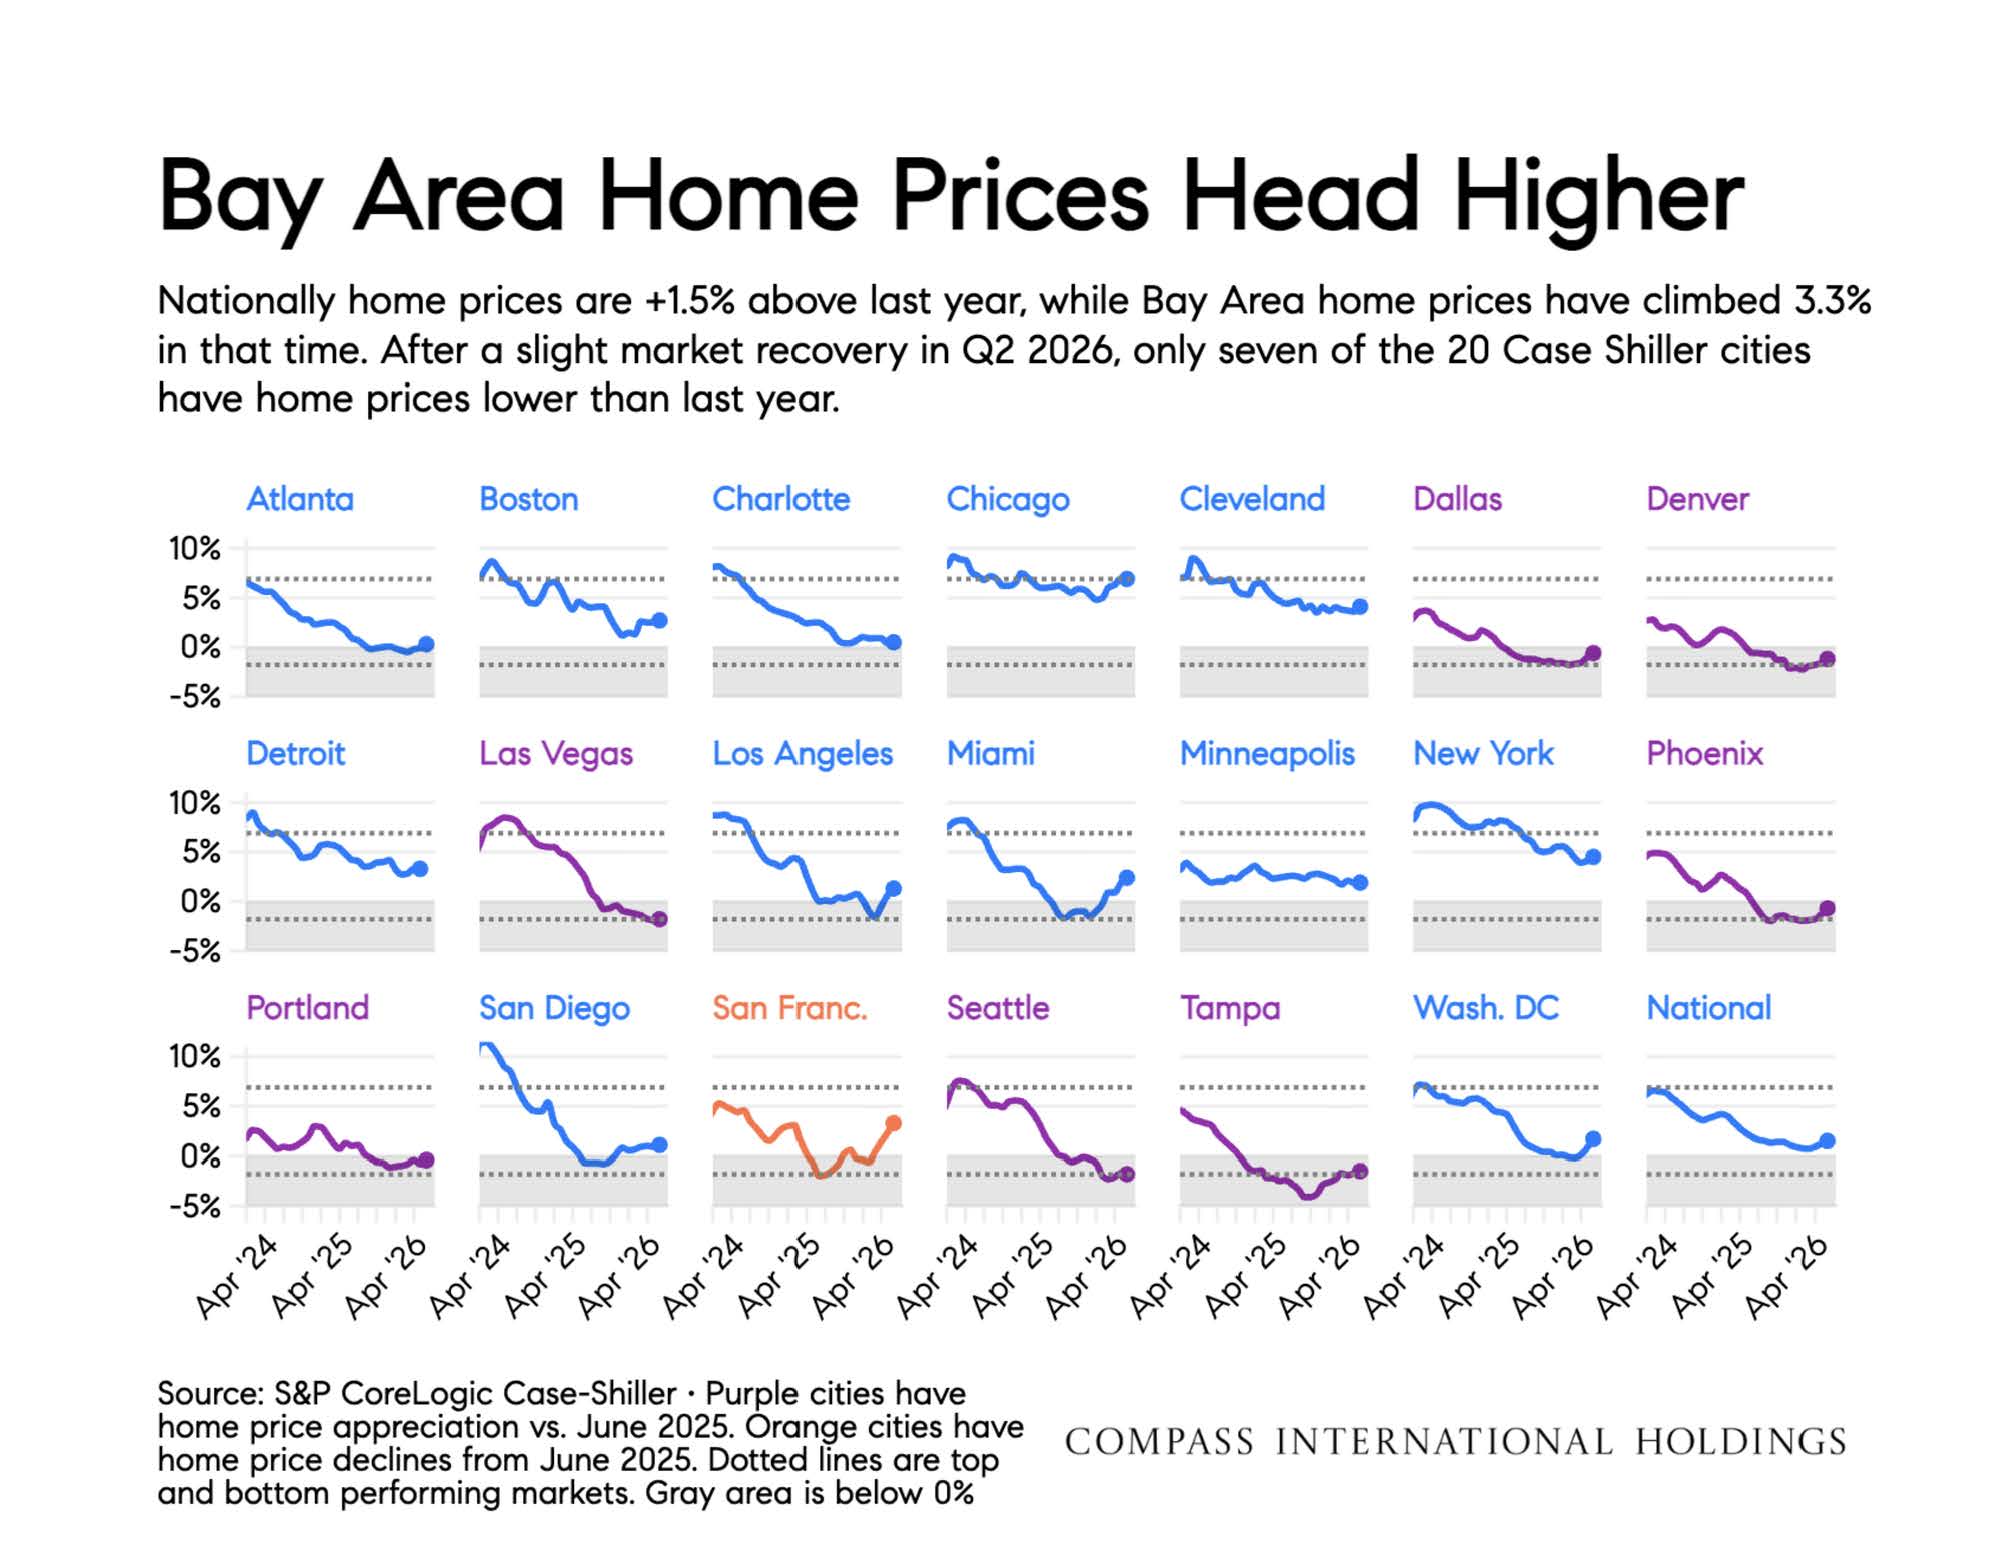
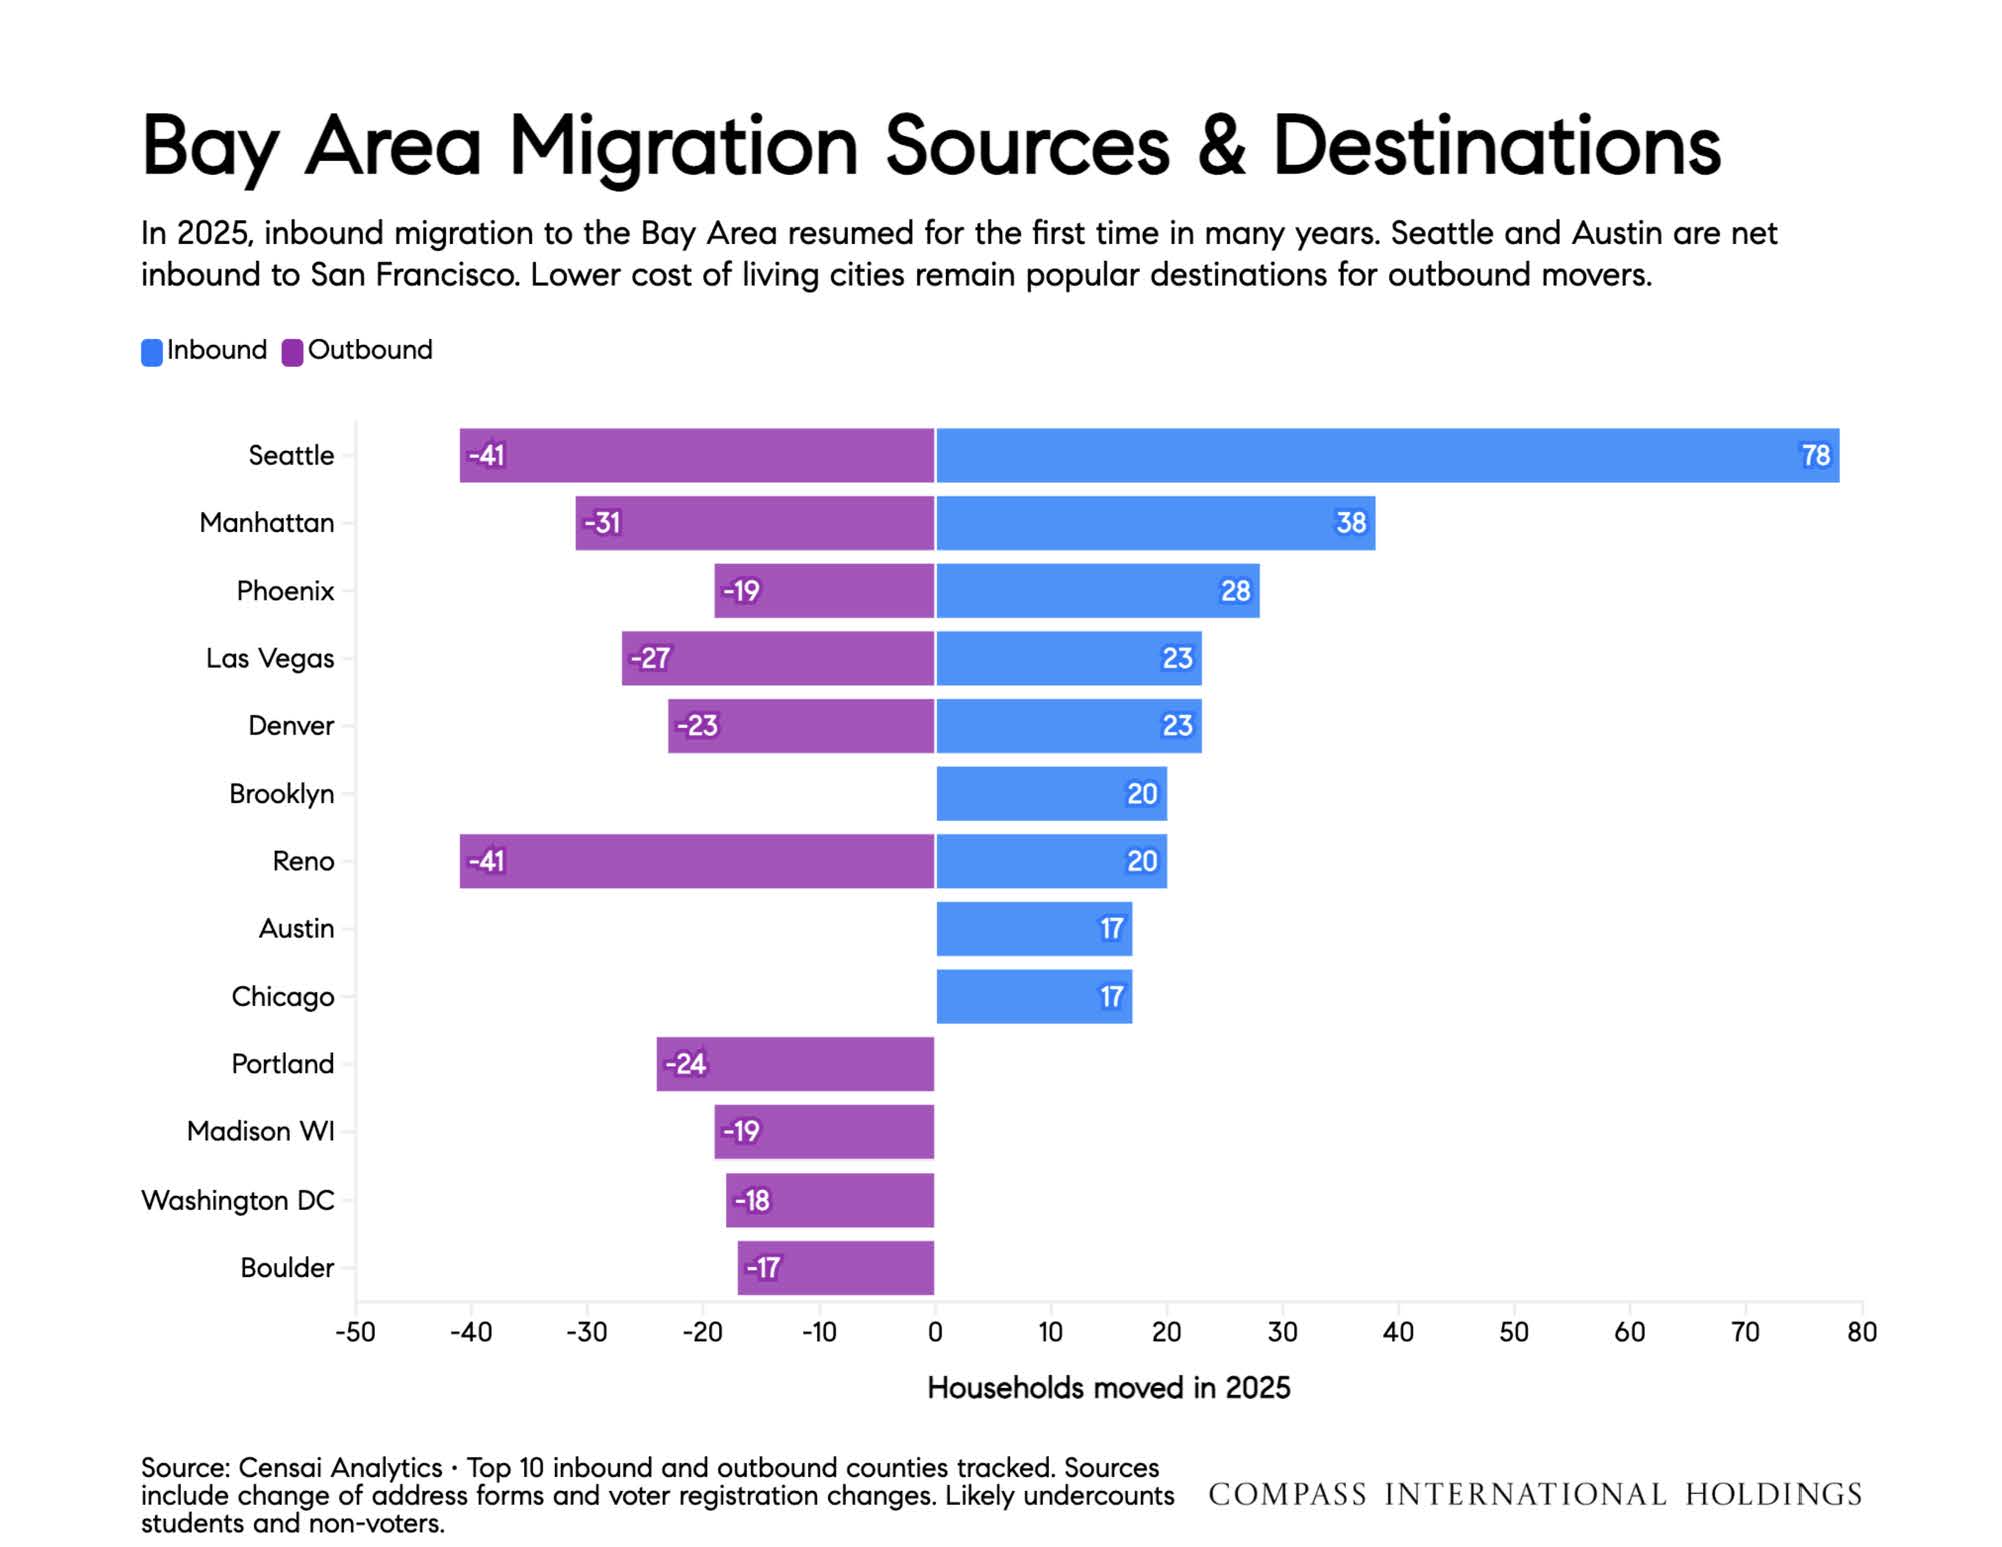
Here's some additional color on the Bay Area market, and how San Francisco compares:
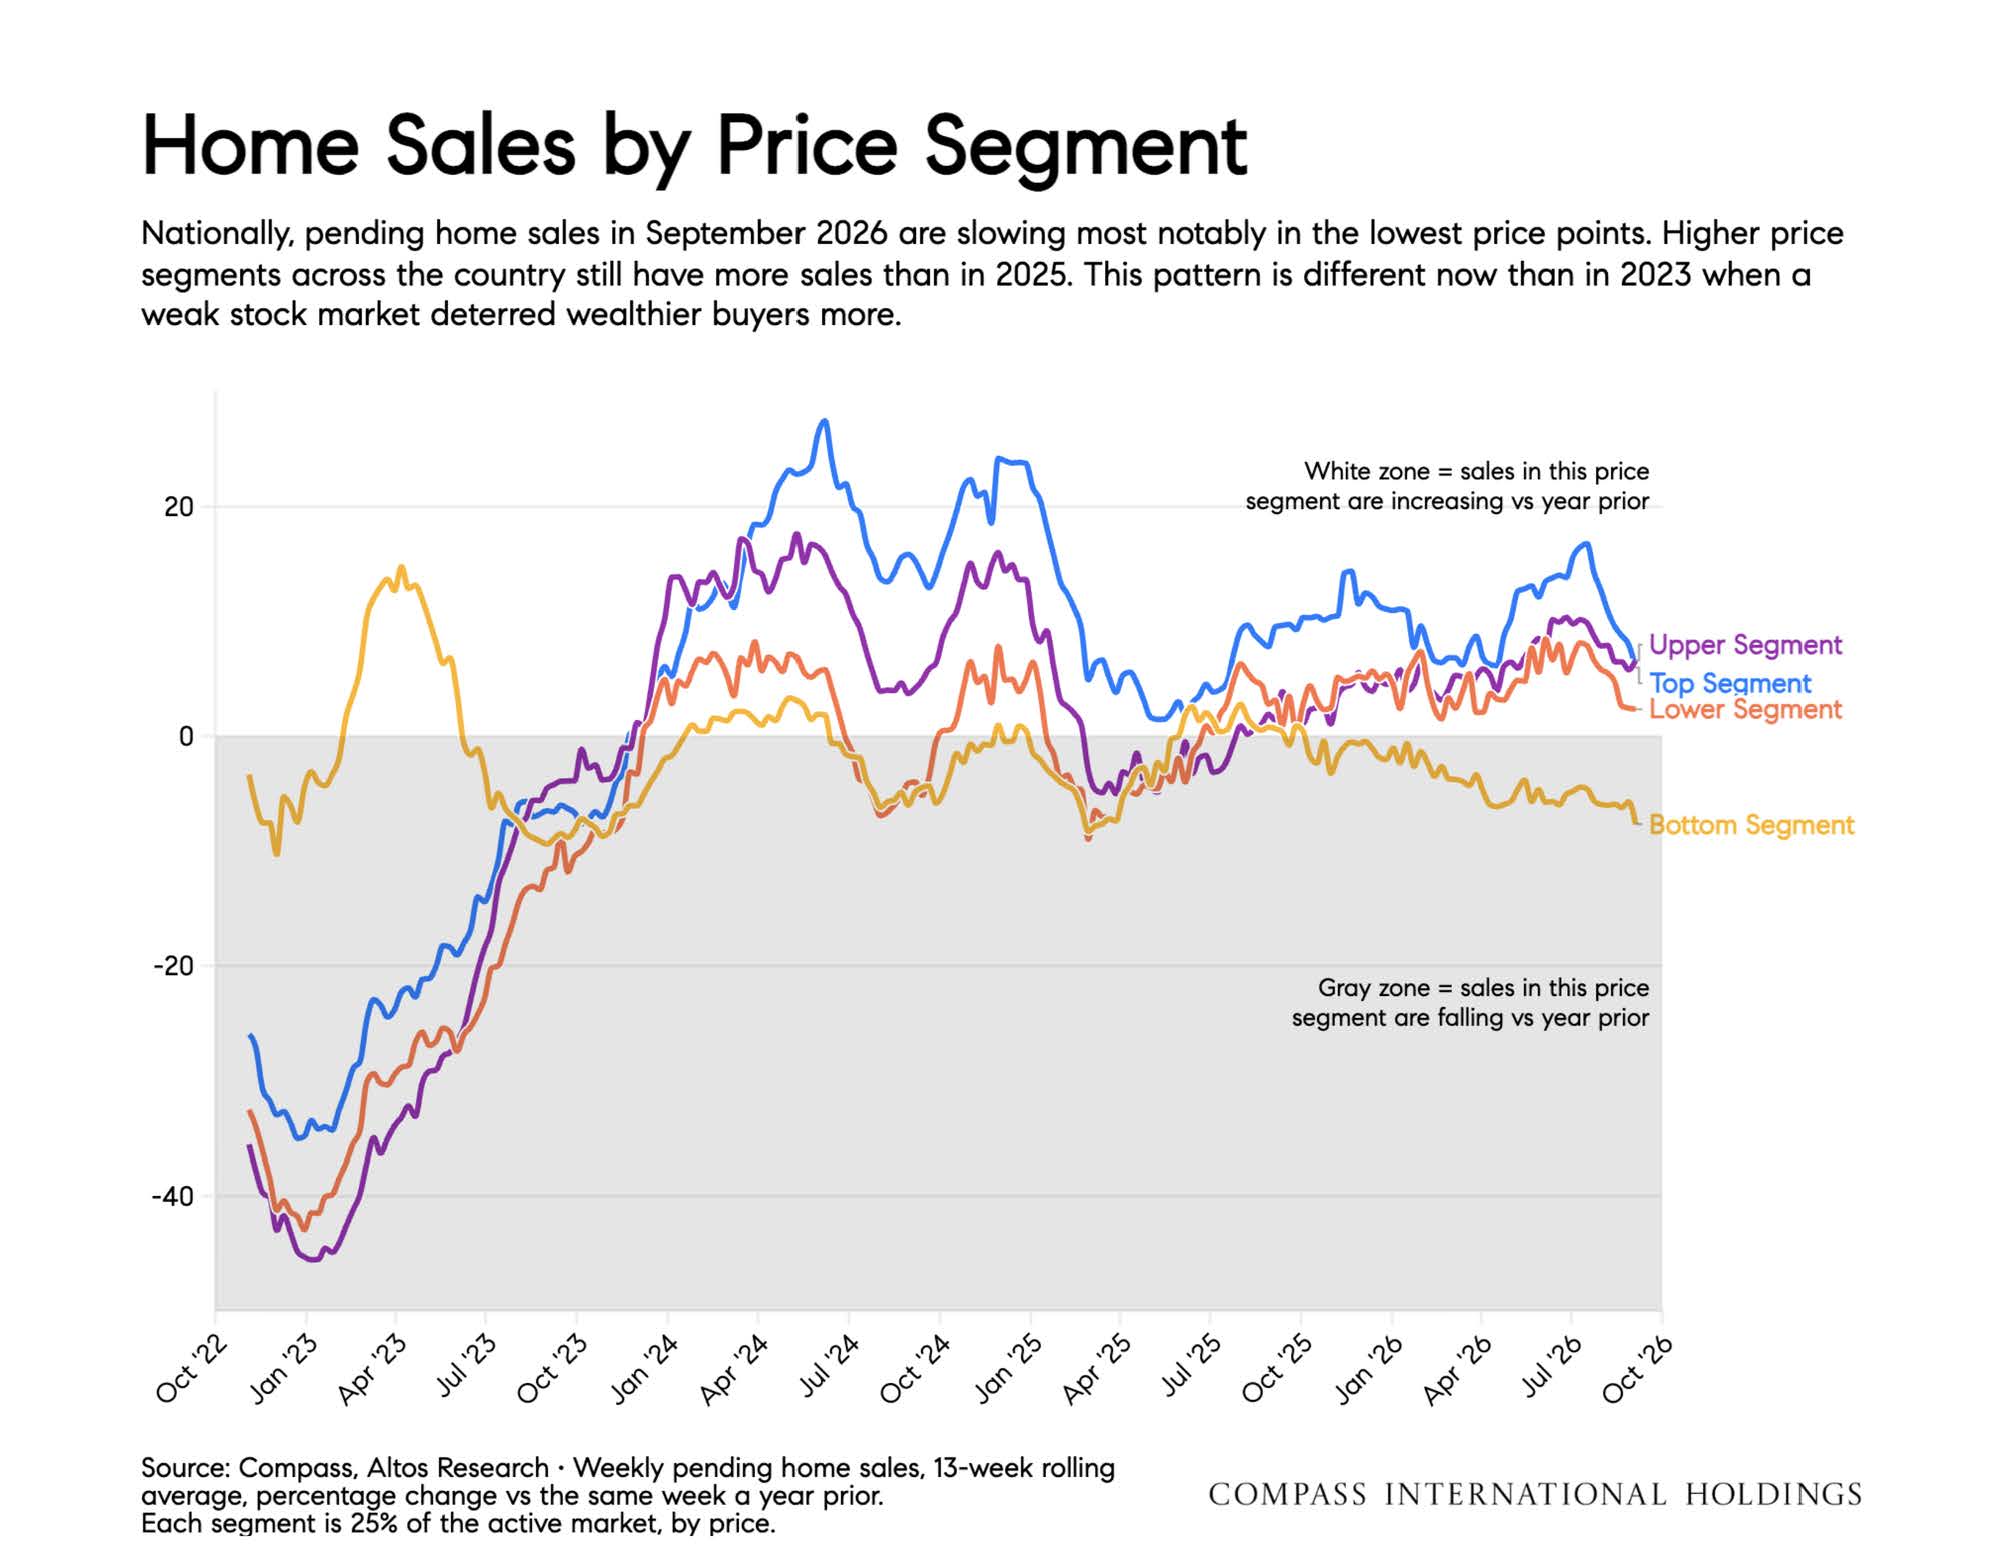
August marked a broad seasonal cooling across the Bay Area. Closings declined year over year in 13 of 14 counties and month over month in 12, while months of supply increased from July in 13 counties. The shift reflects the typical late-summer slowdown as the market transitions from the spring/summer peak toward the fall market peak.
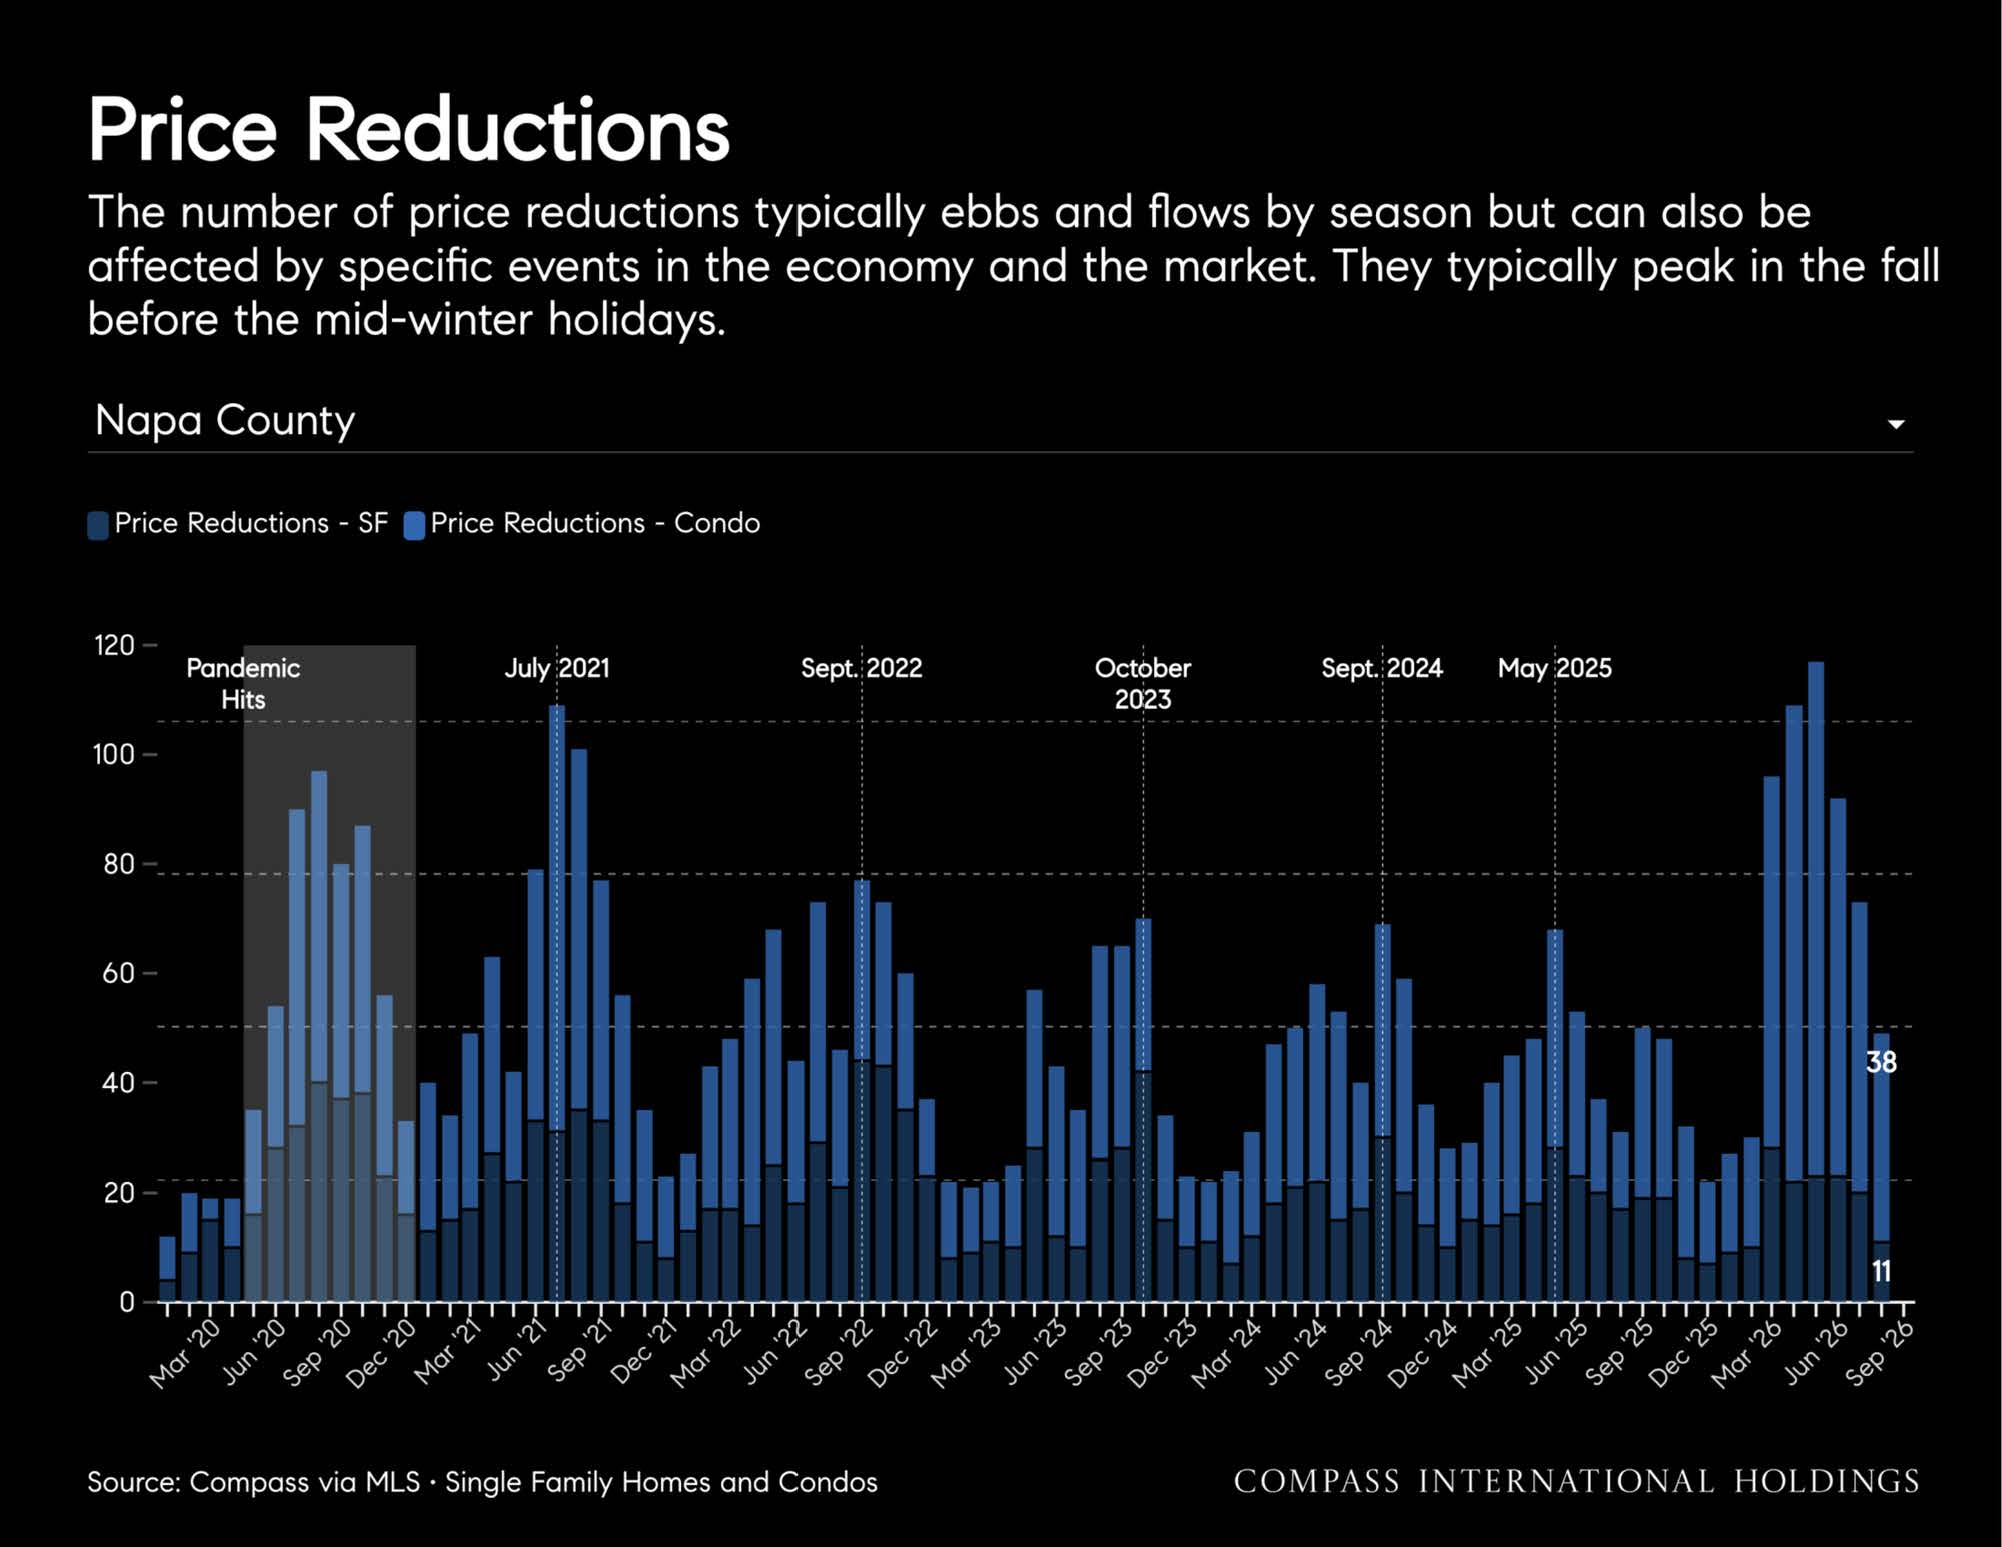
Competition remained stronger than a year ago. The share of sales closing above list increased year over year in all 14 counties, while average days on market improved in 11. Price reductions increased in 10 counties, consistent with the seasonal rise in listing adjustments as the market moves toward fall and winter.
Single-family homes continued to show stronger market conditions than condos. Single-family closings fell year over year in nine counties but increased in five, and days on market declined in 13. The share of sales closing above list increased across every county. By contrast, condo price reductions increased in 12 counties, while condo days on market rose in six — signaling a more uneven recovery.
Condo momentum appears to be moderating after a strong summer. The condo median increased year over year in six counties and declined in eight, while the share of condos selling above list rose in only eight. August is the first month of data following new condo lending regulations, so it is too early to determine whether the slowdown reflects the regulations or the normal late-summer seasonal pattern.
San Francisco remains the regional standout. Condo sales increased 11% year over year to 214, the condo median rose 22% to $1.23 million, and active condo listings fell 36%. San Francisco was the only county where condos showed both meaningful price and closed transaction growth.
September watch: The strongest appreciation outside San Francisco was concentrated north of the city, with Marin posting the region’s second-highest year-over-year gain. Condo sales and pricing will be closely watched to determine whether August’s slowdown is temporary or the beginning of a broader shift. The performance of smaller versus larger condo buildings will also be important, particularly as the impact of the new lending regulations becomes clearer. Atherton’s nearly $10 million increase in its median price, driven by a few high-value sales, will be another notable test of whether recent gains will be sustained.
If you have any questions about a specific property, the market, or how to navigate your current situation, I'm always here and happy to help.
Warmly,
Ron
Recent sales, in-contracts, and reviews below + additional charts & data